- THE HUMAN PROTEOME
- THE HUMAN TISSUES
- THE HUMAN CELL
- PROTEIN CLASSES
- PROTEIN EVIDENCE
- NEWS
- BLOG
- EVENTS
- PRESS ROOM
- LEARN
- DICTIONARY
- METHODS
- CELL LINES
|
TISSUE ATLAS
PRIMARY DATA
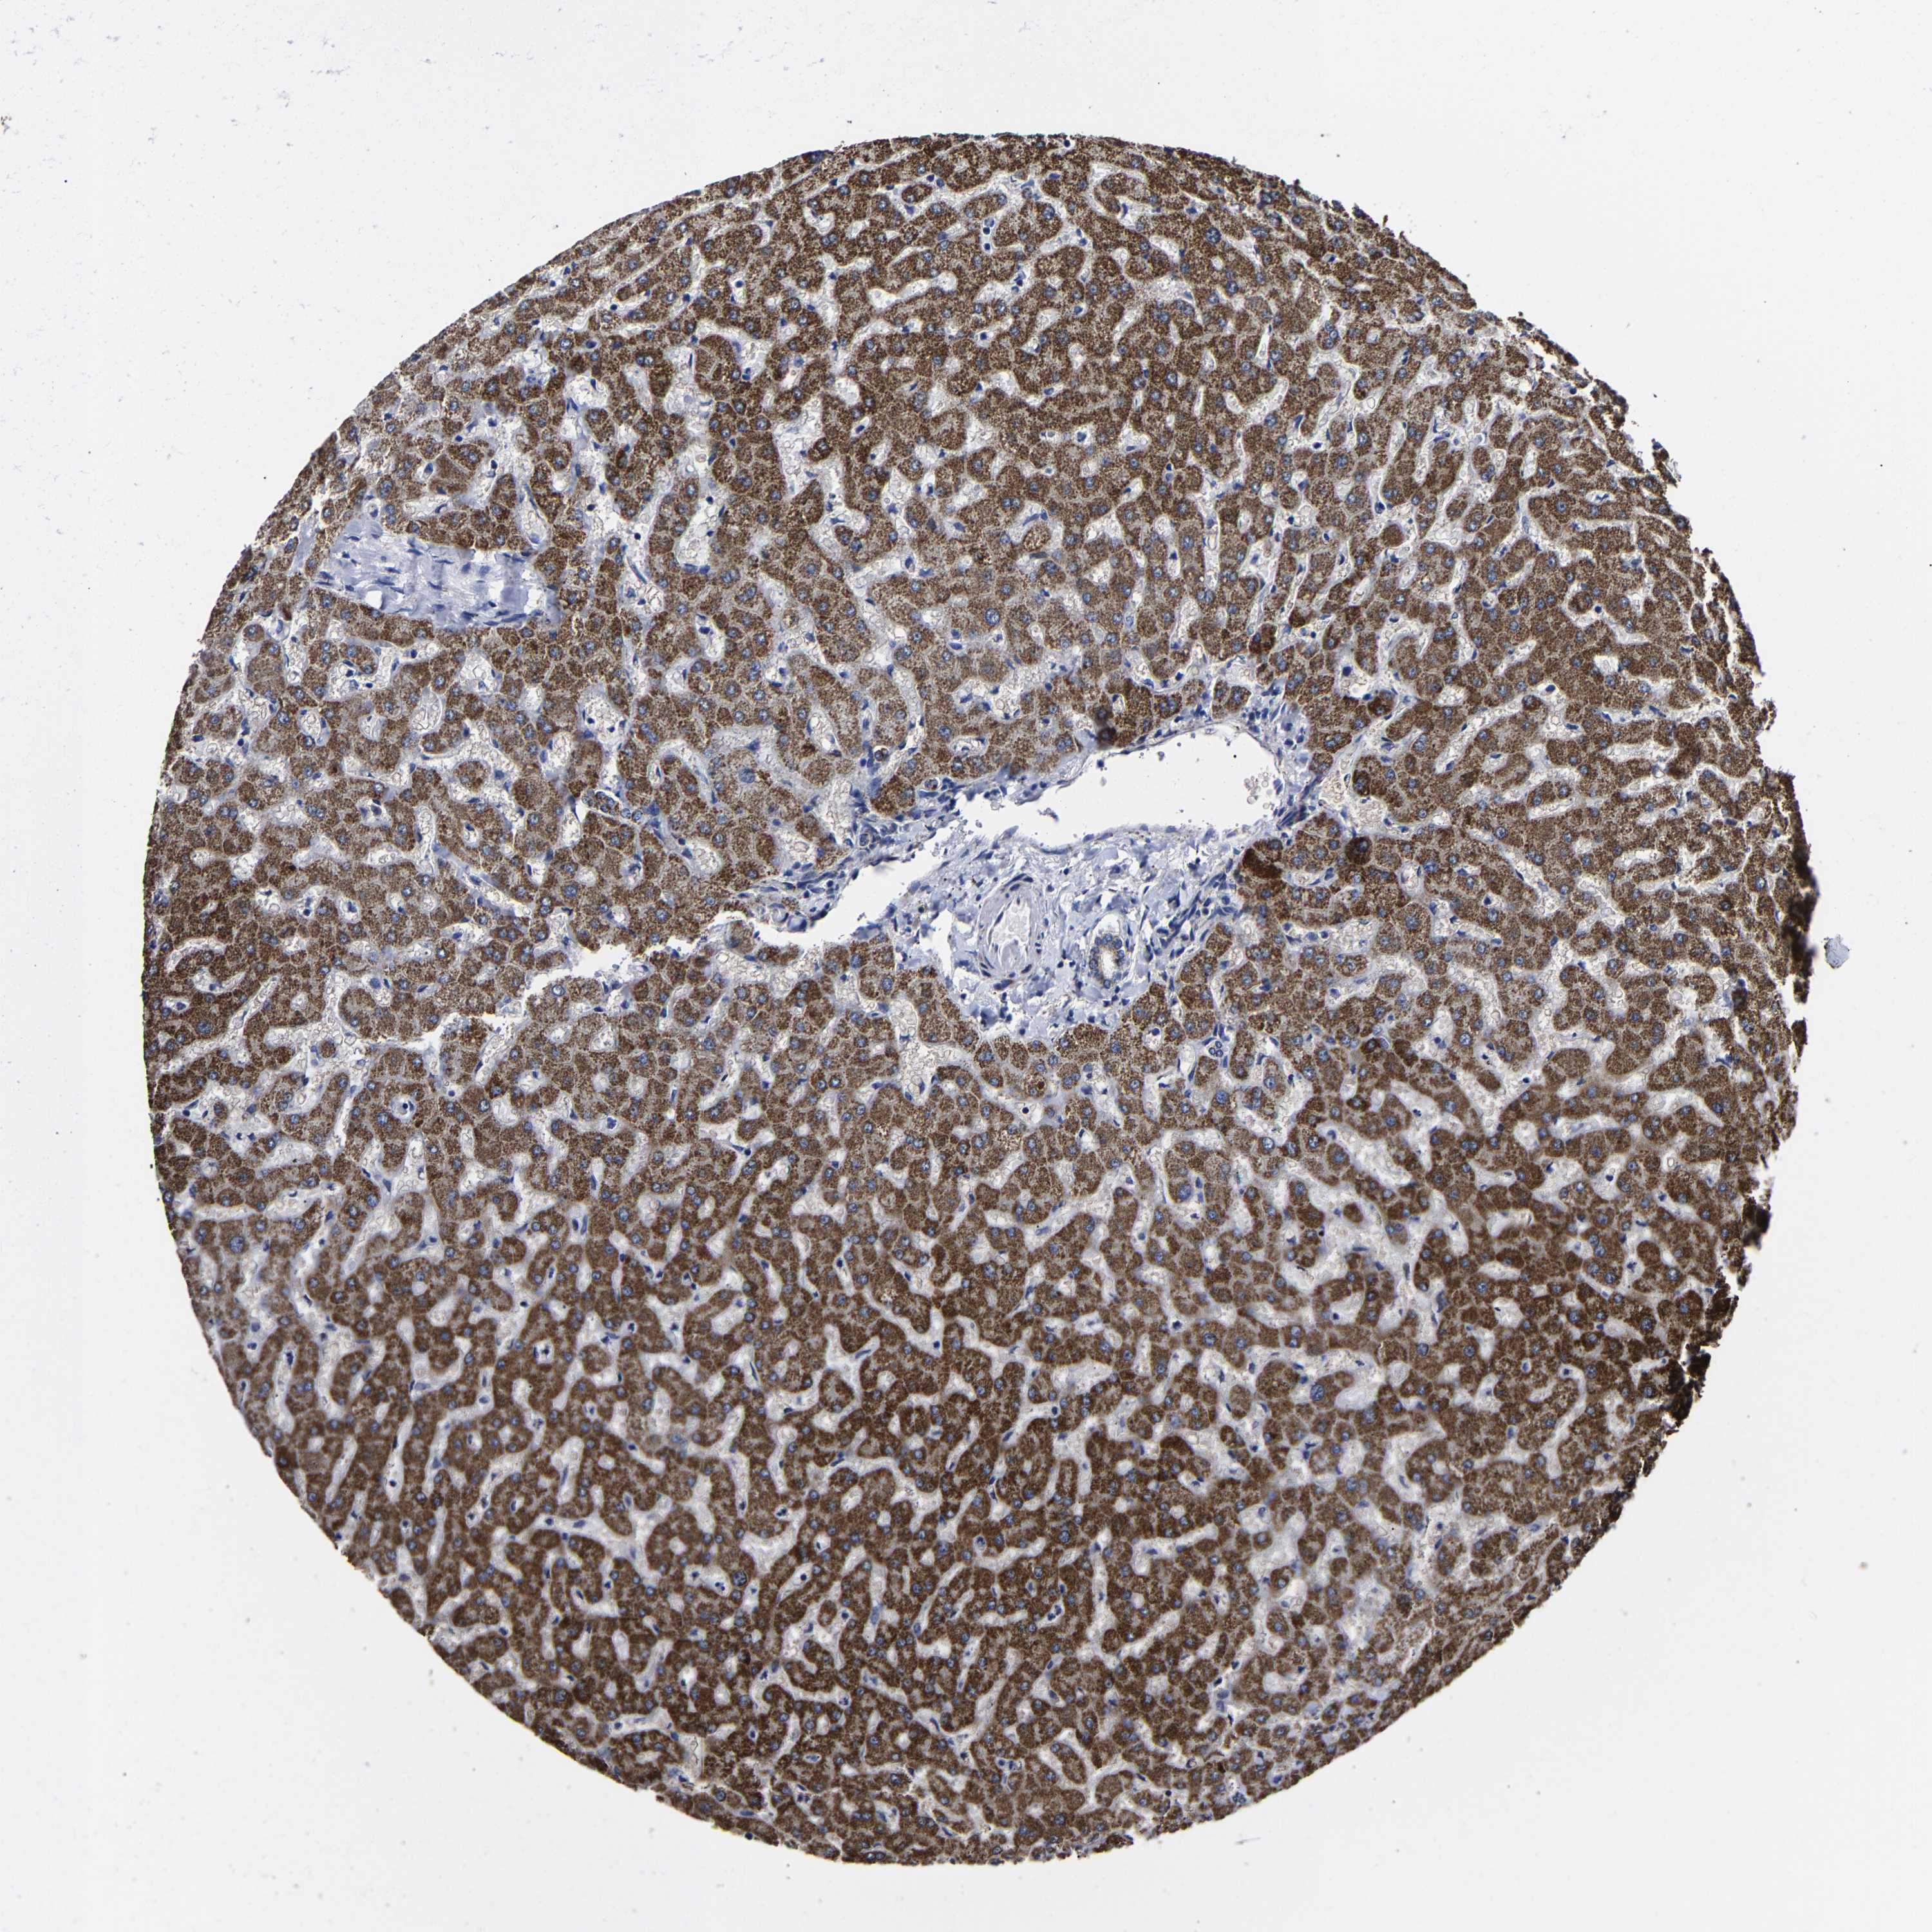
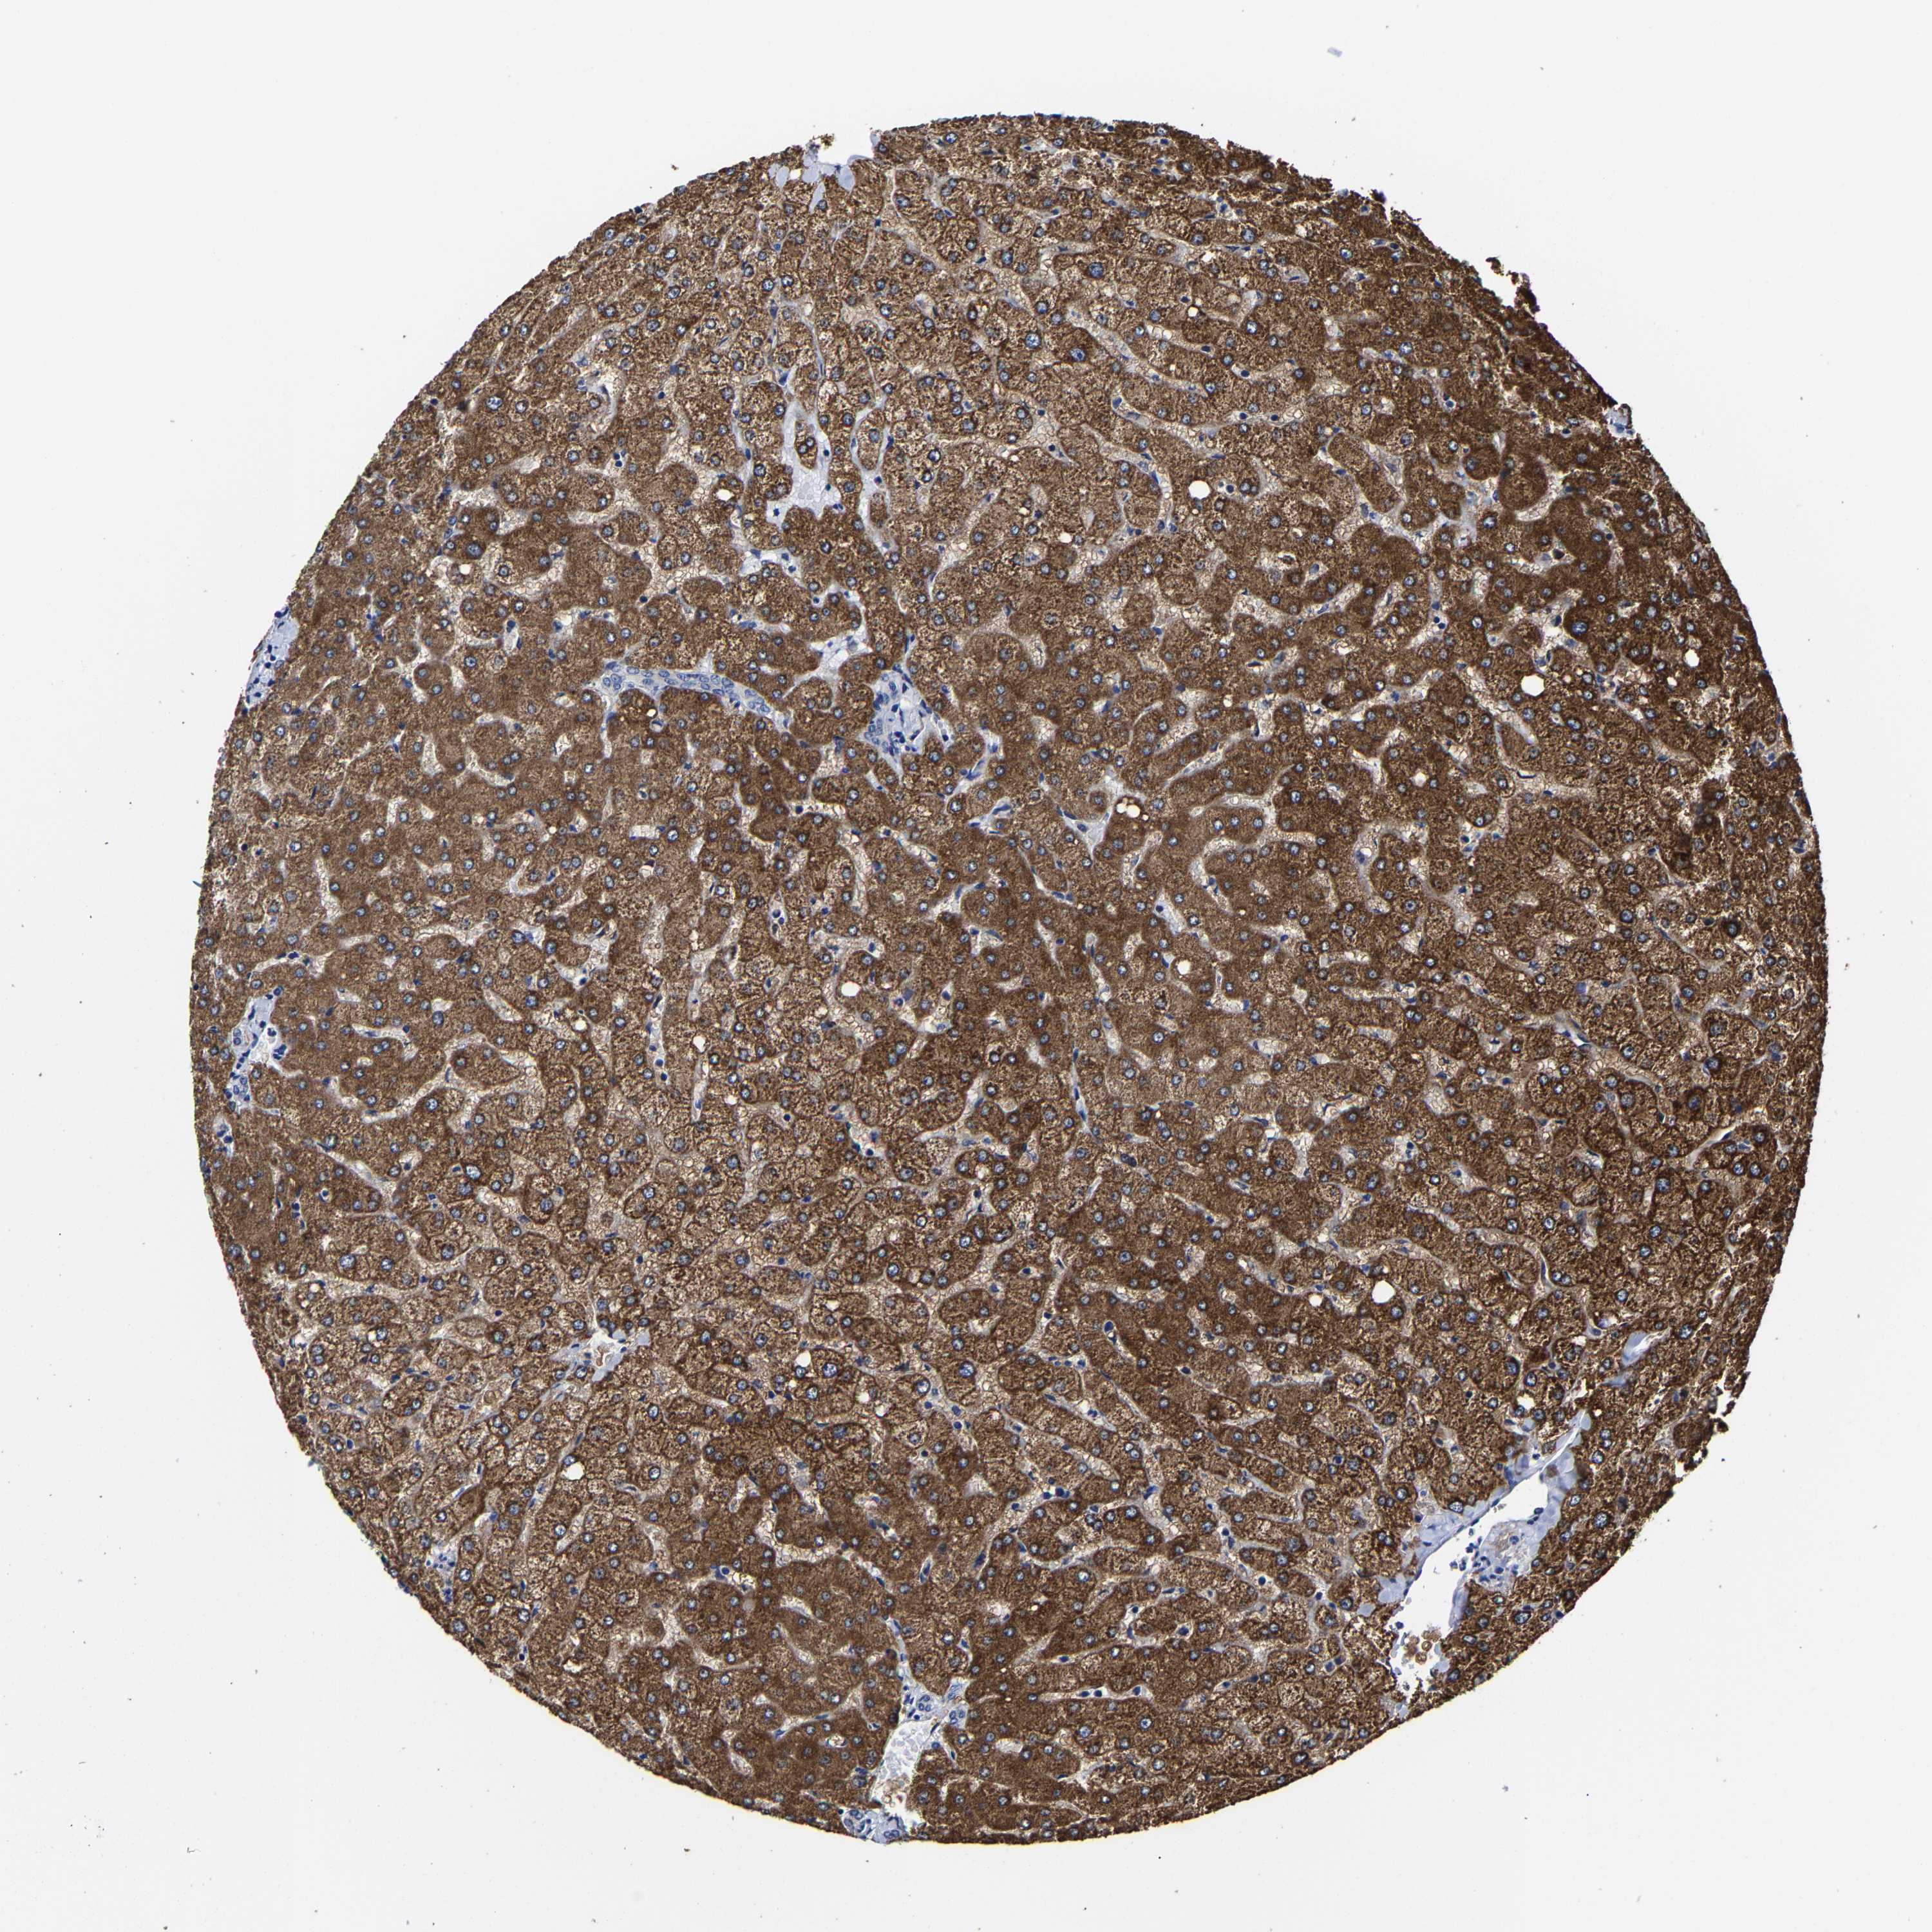
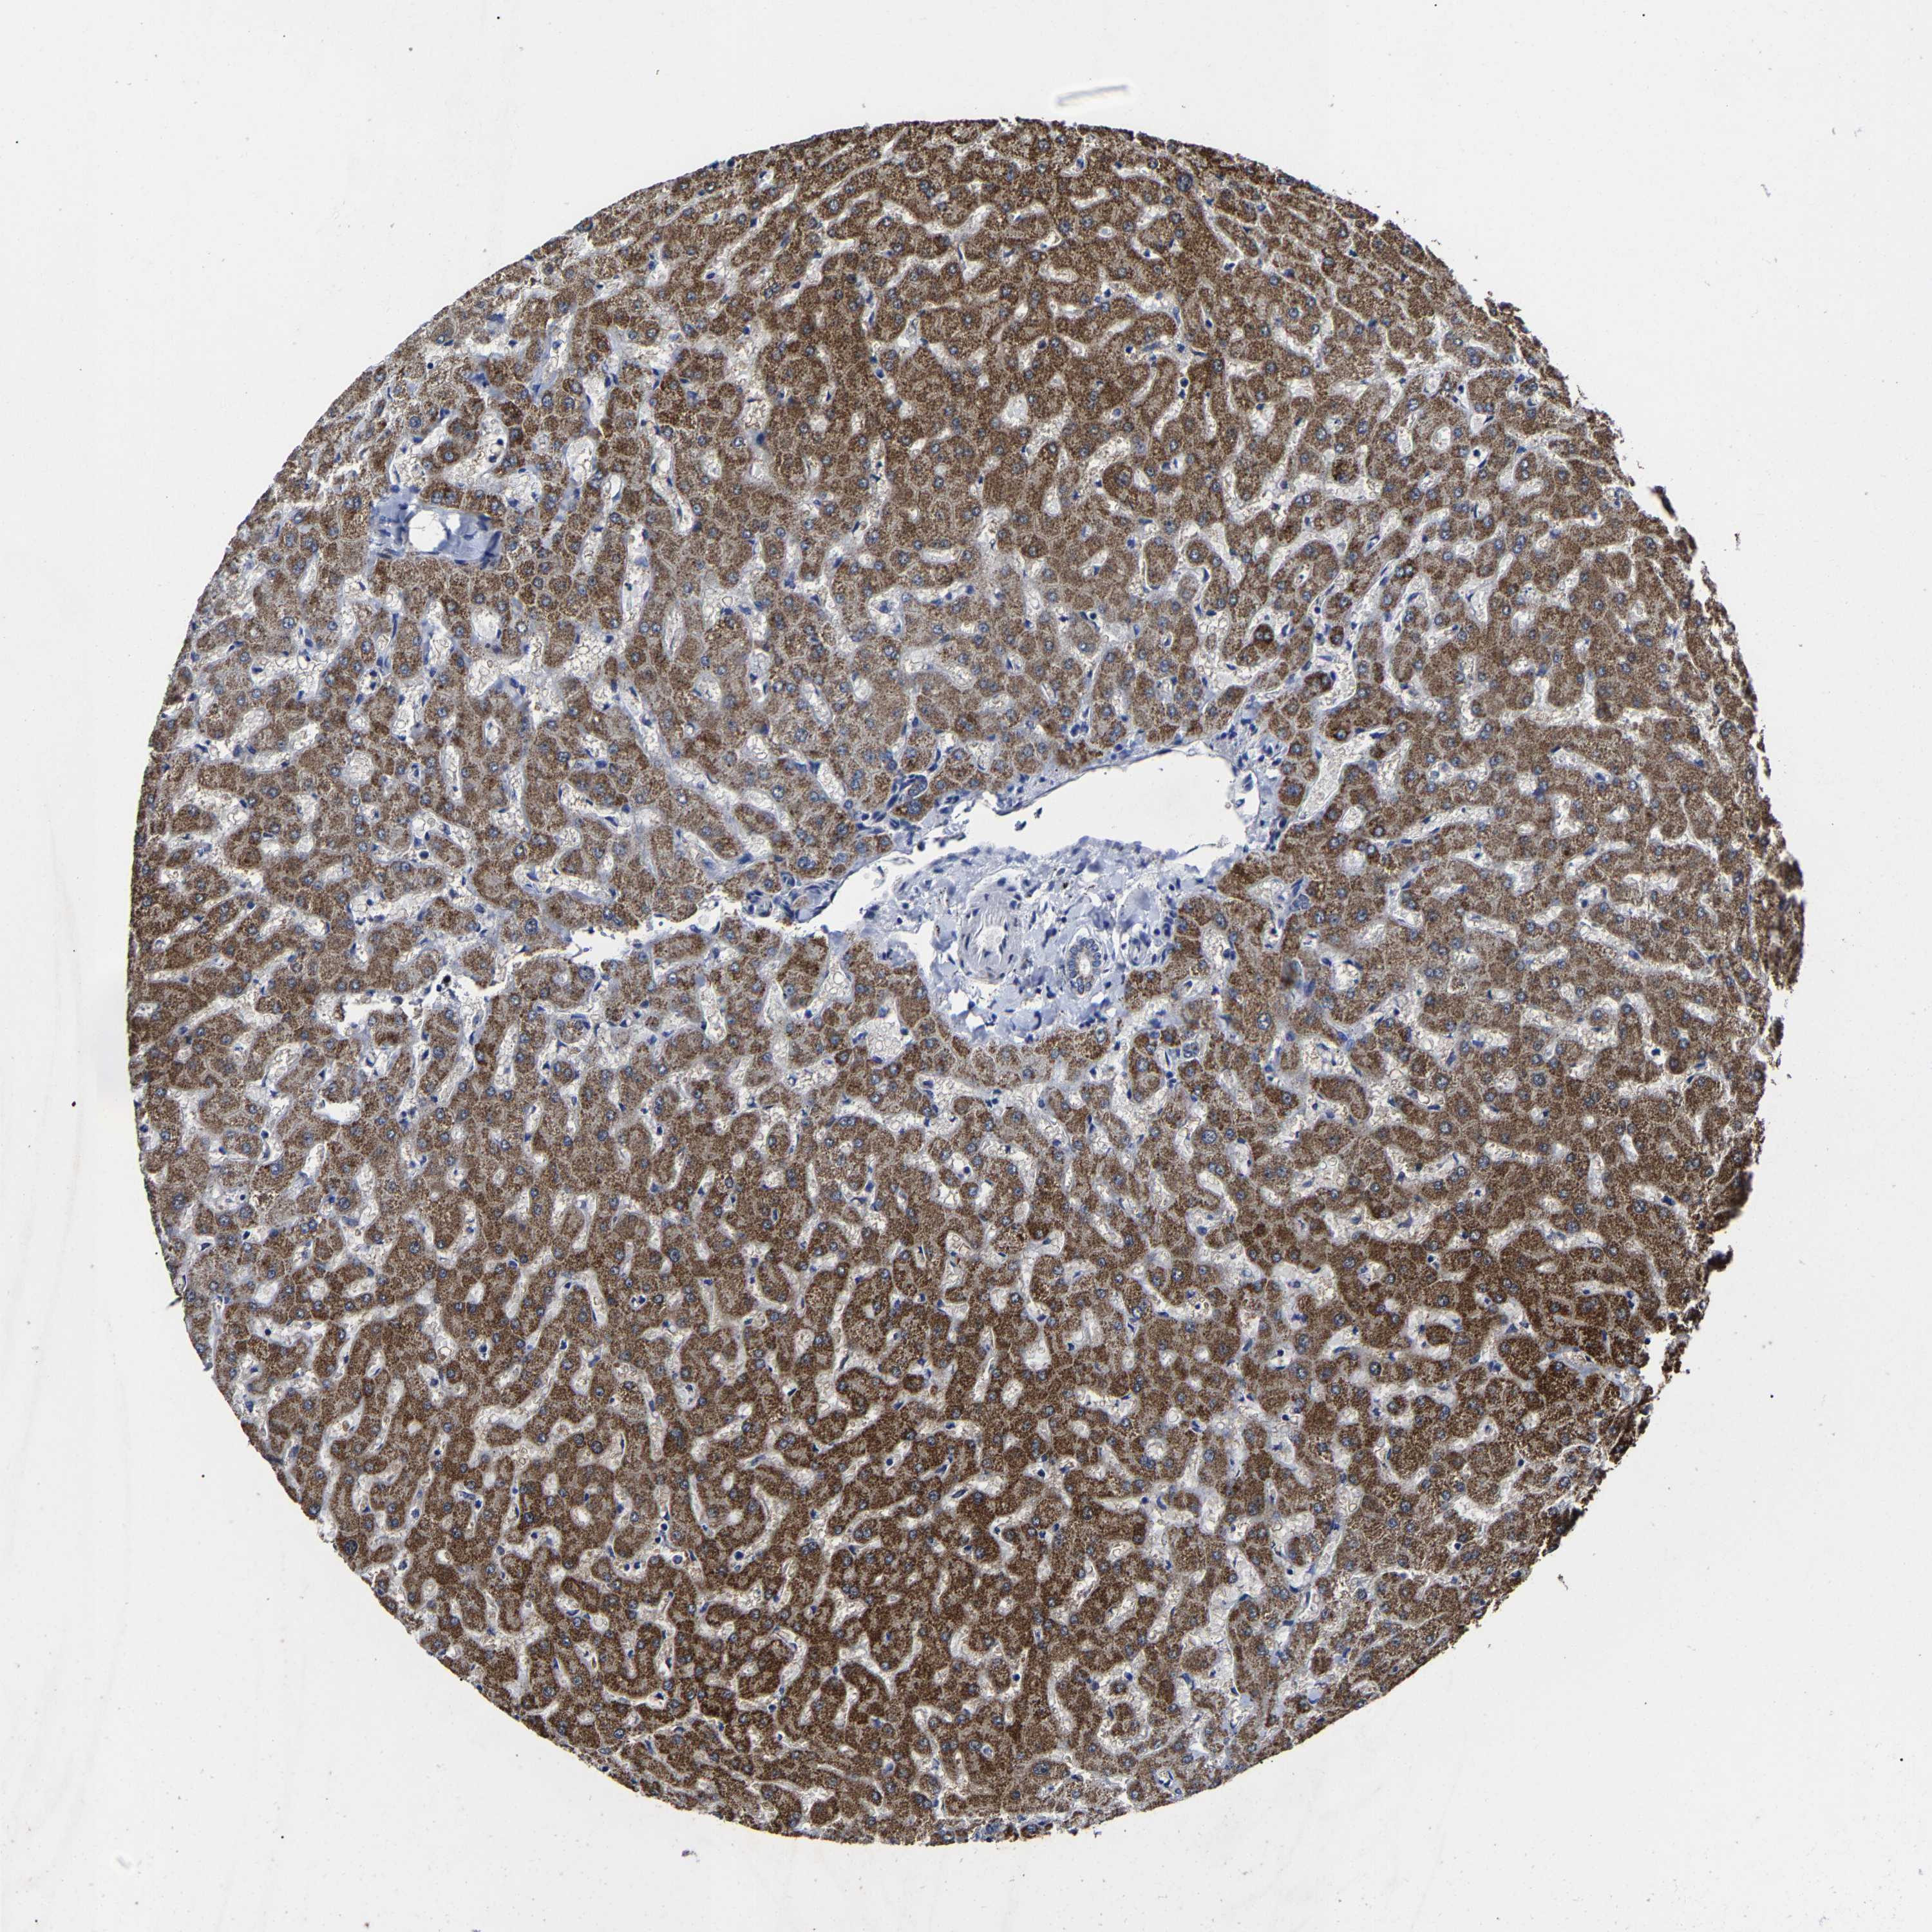
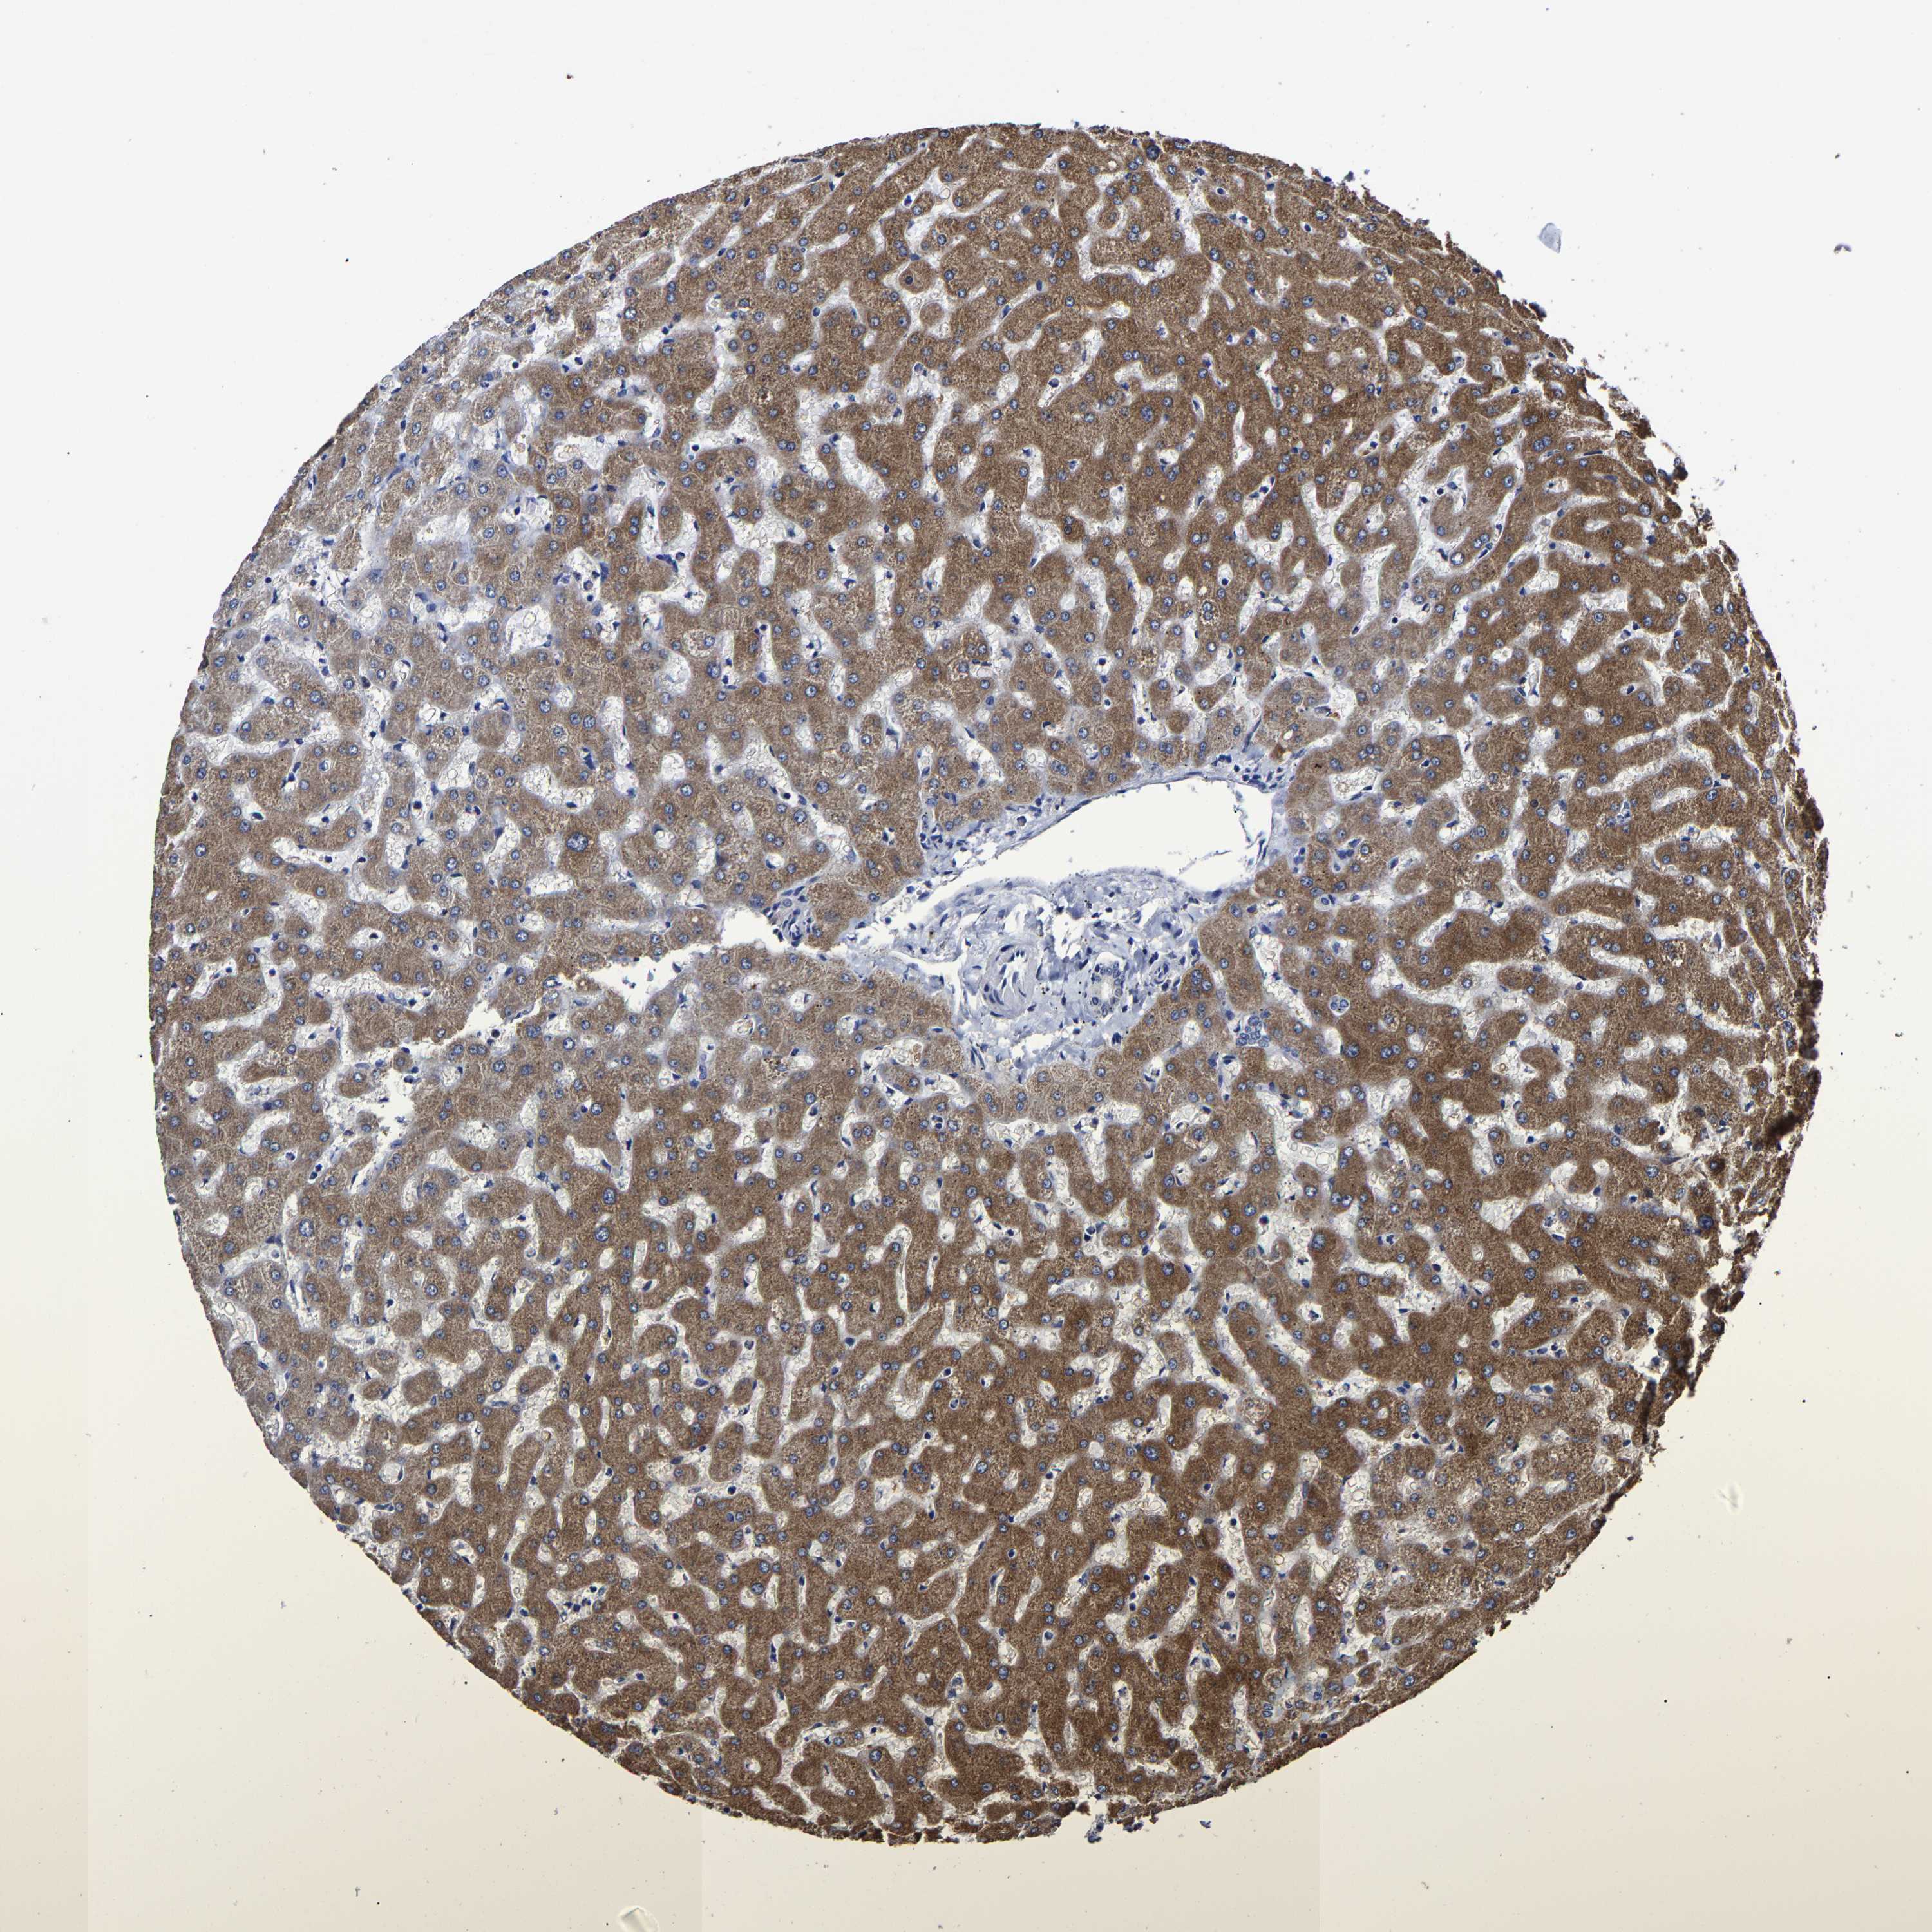
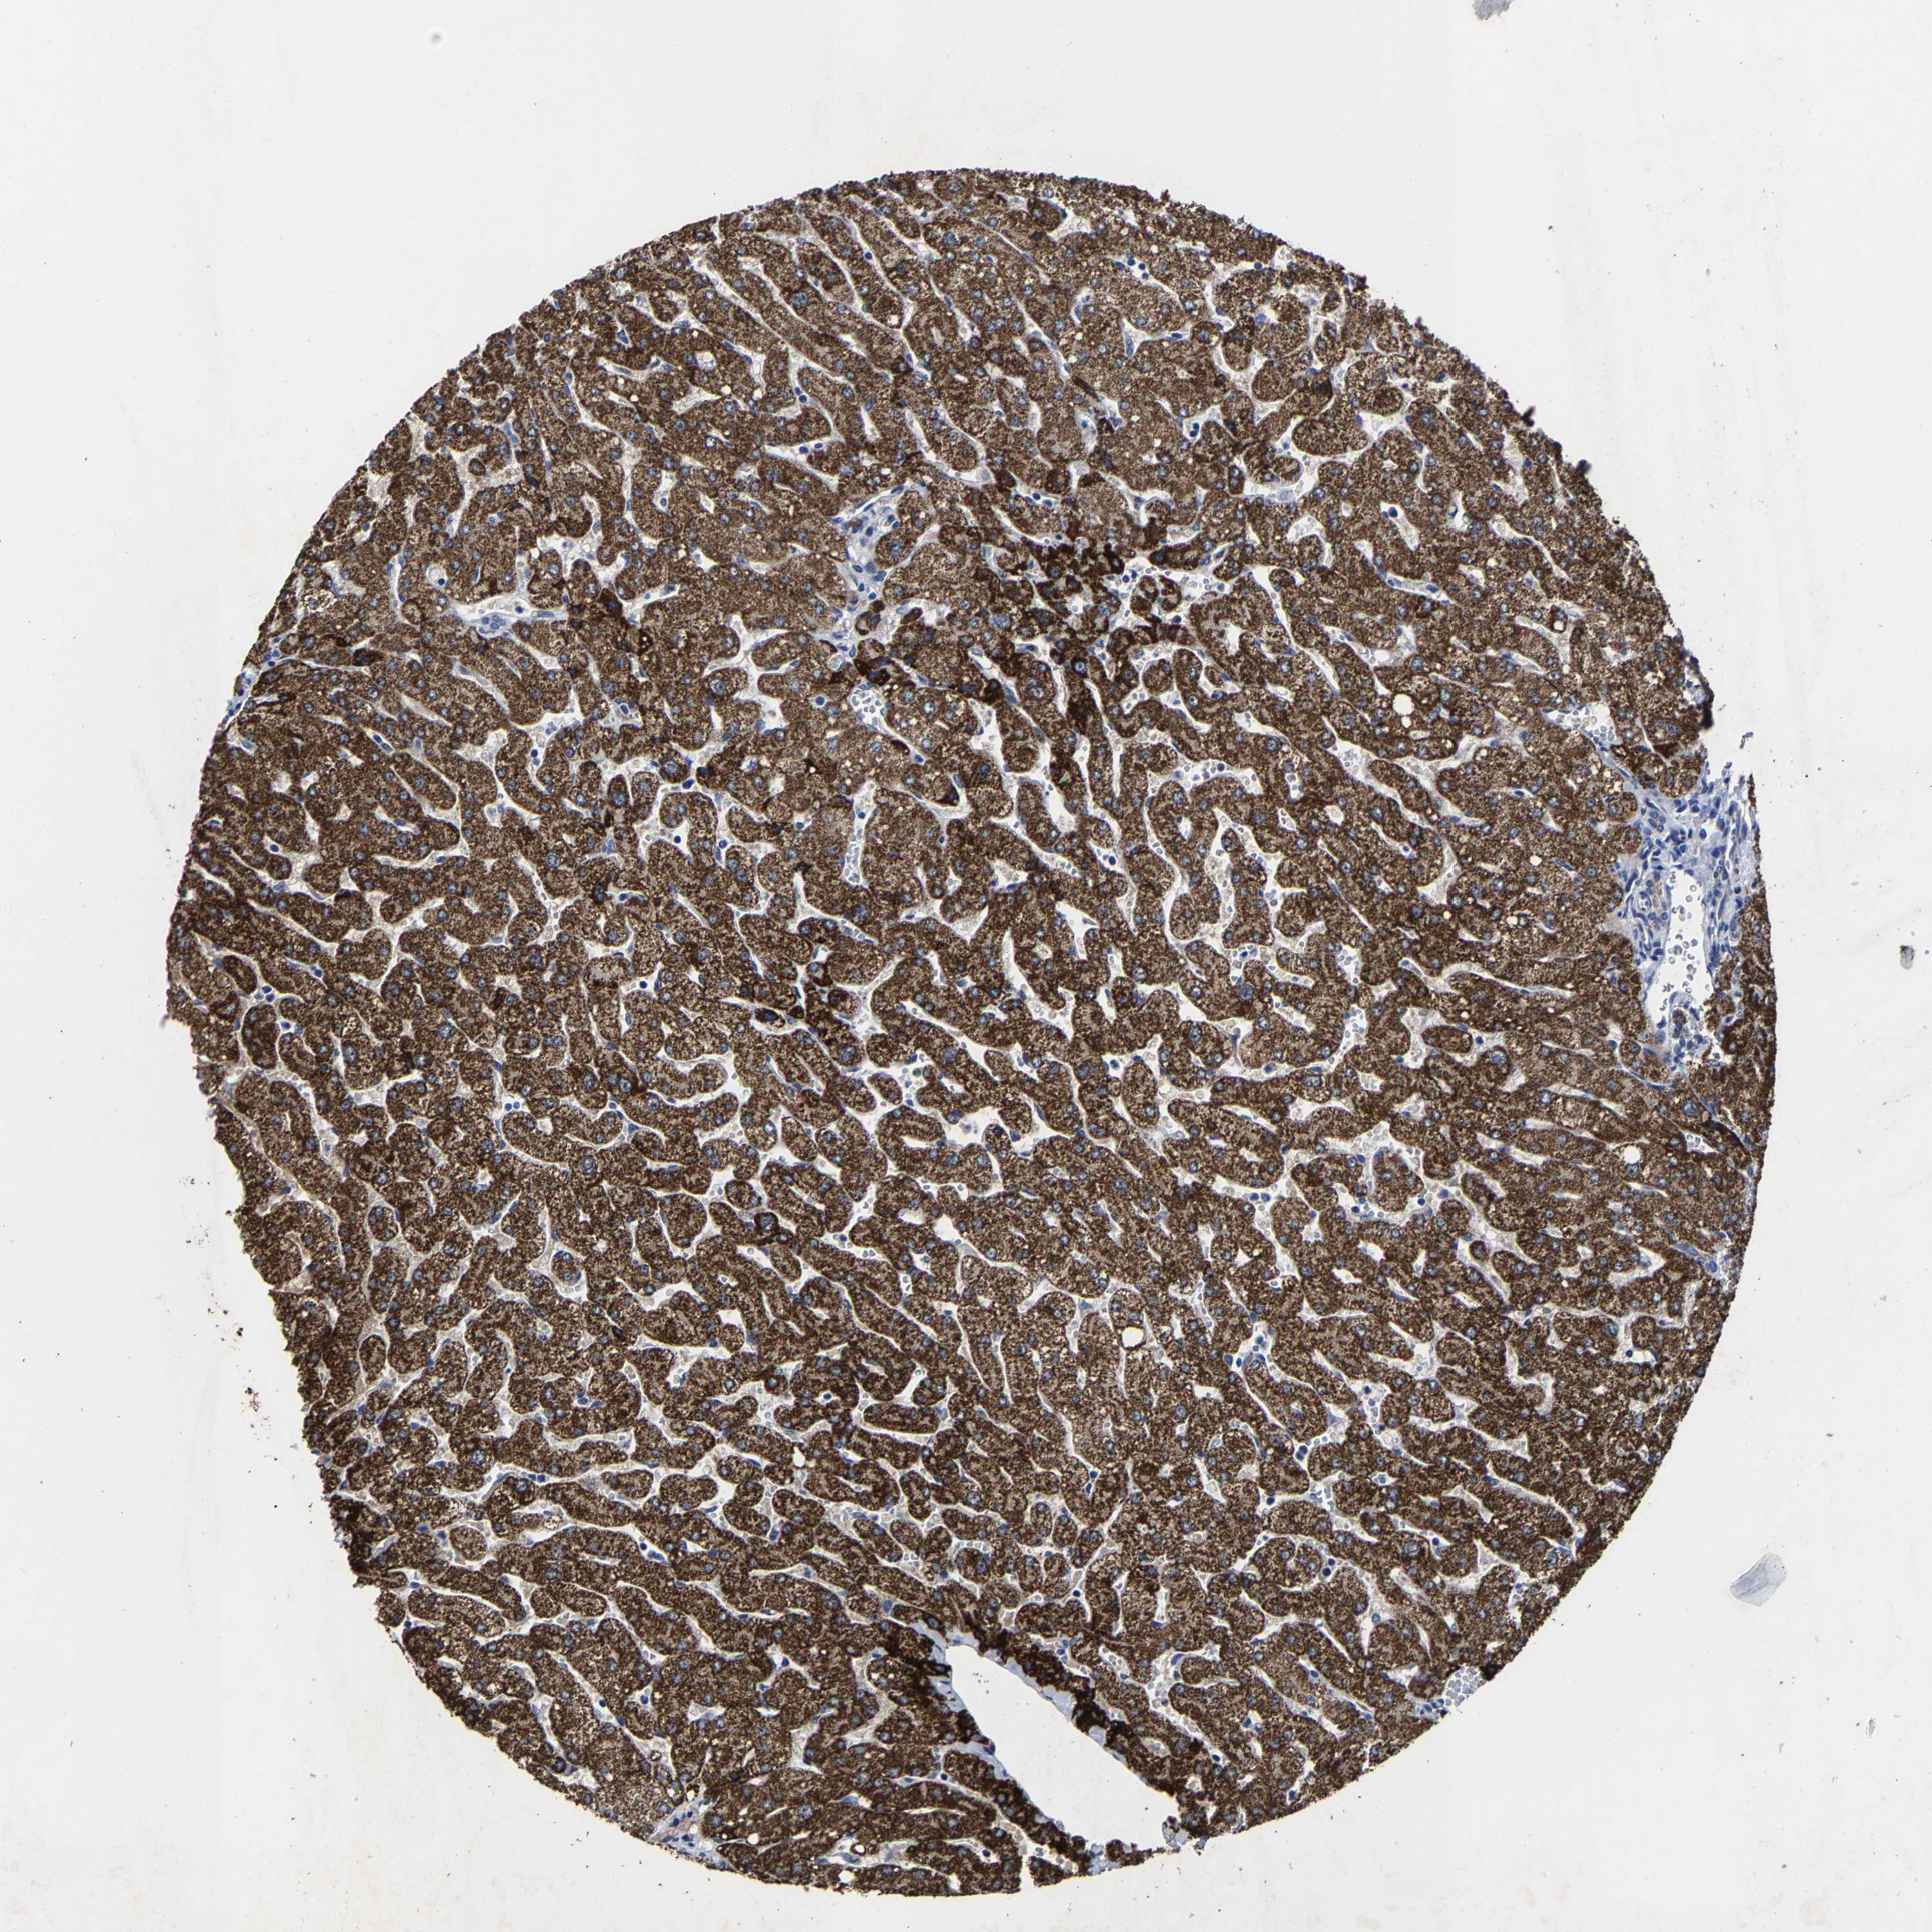
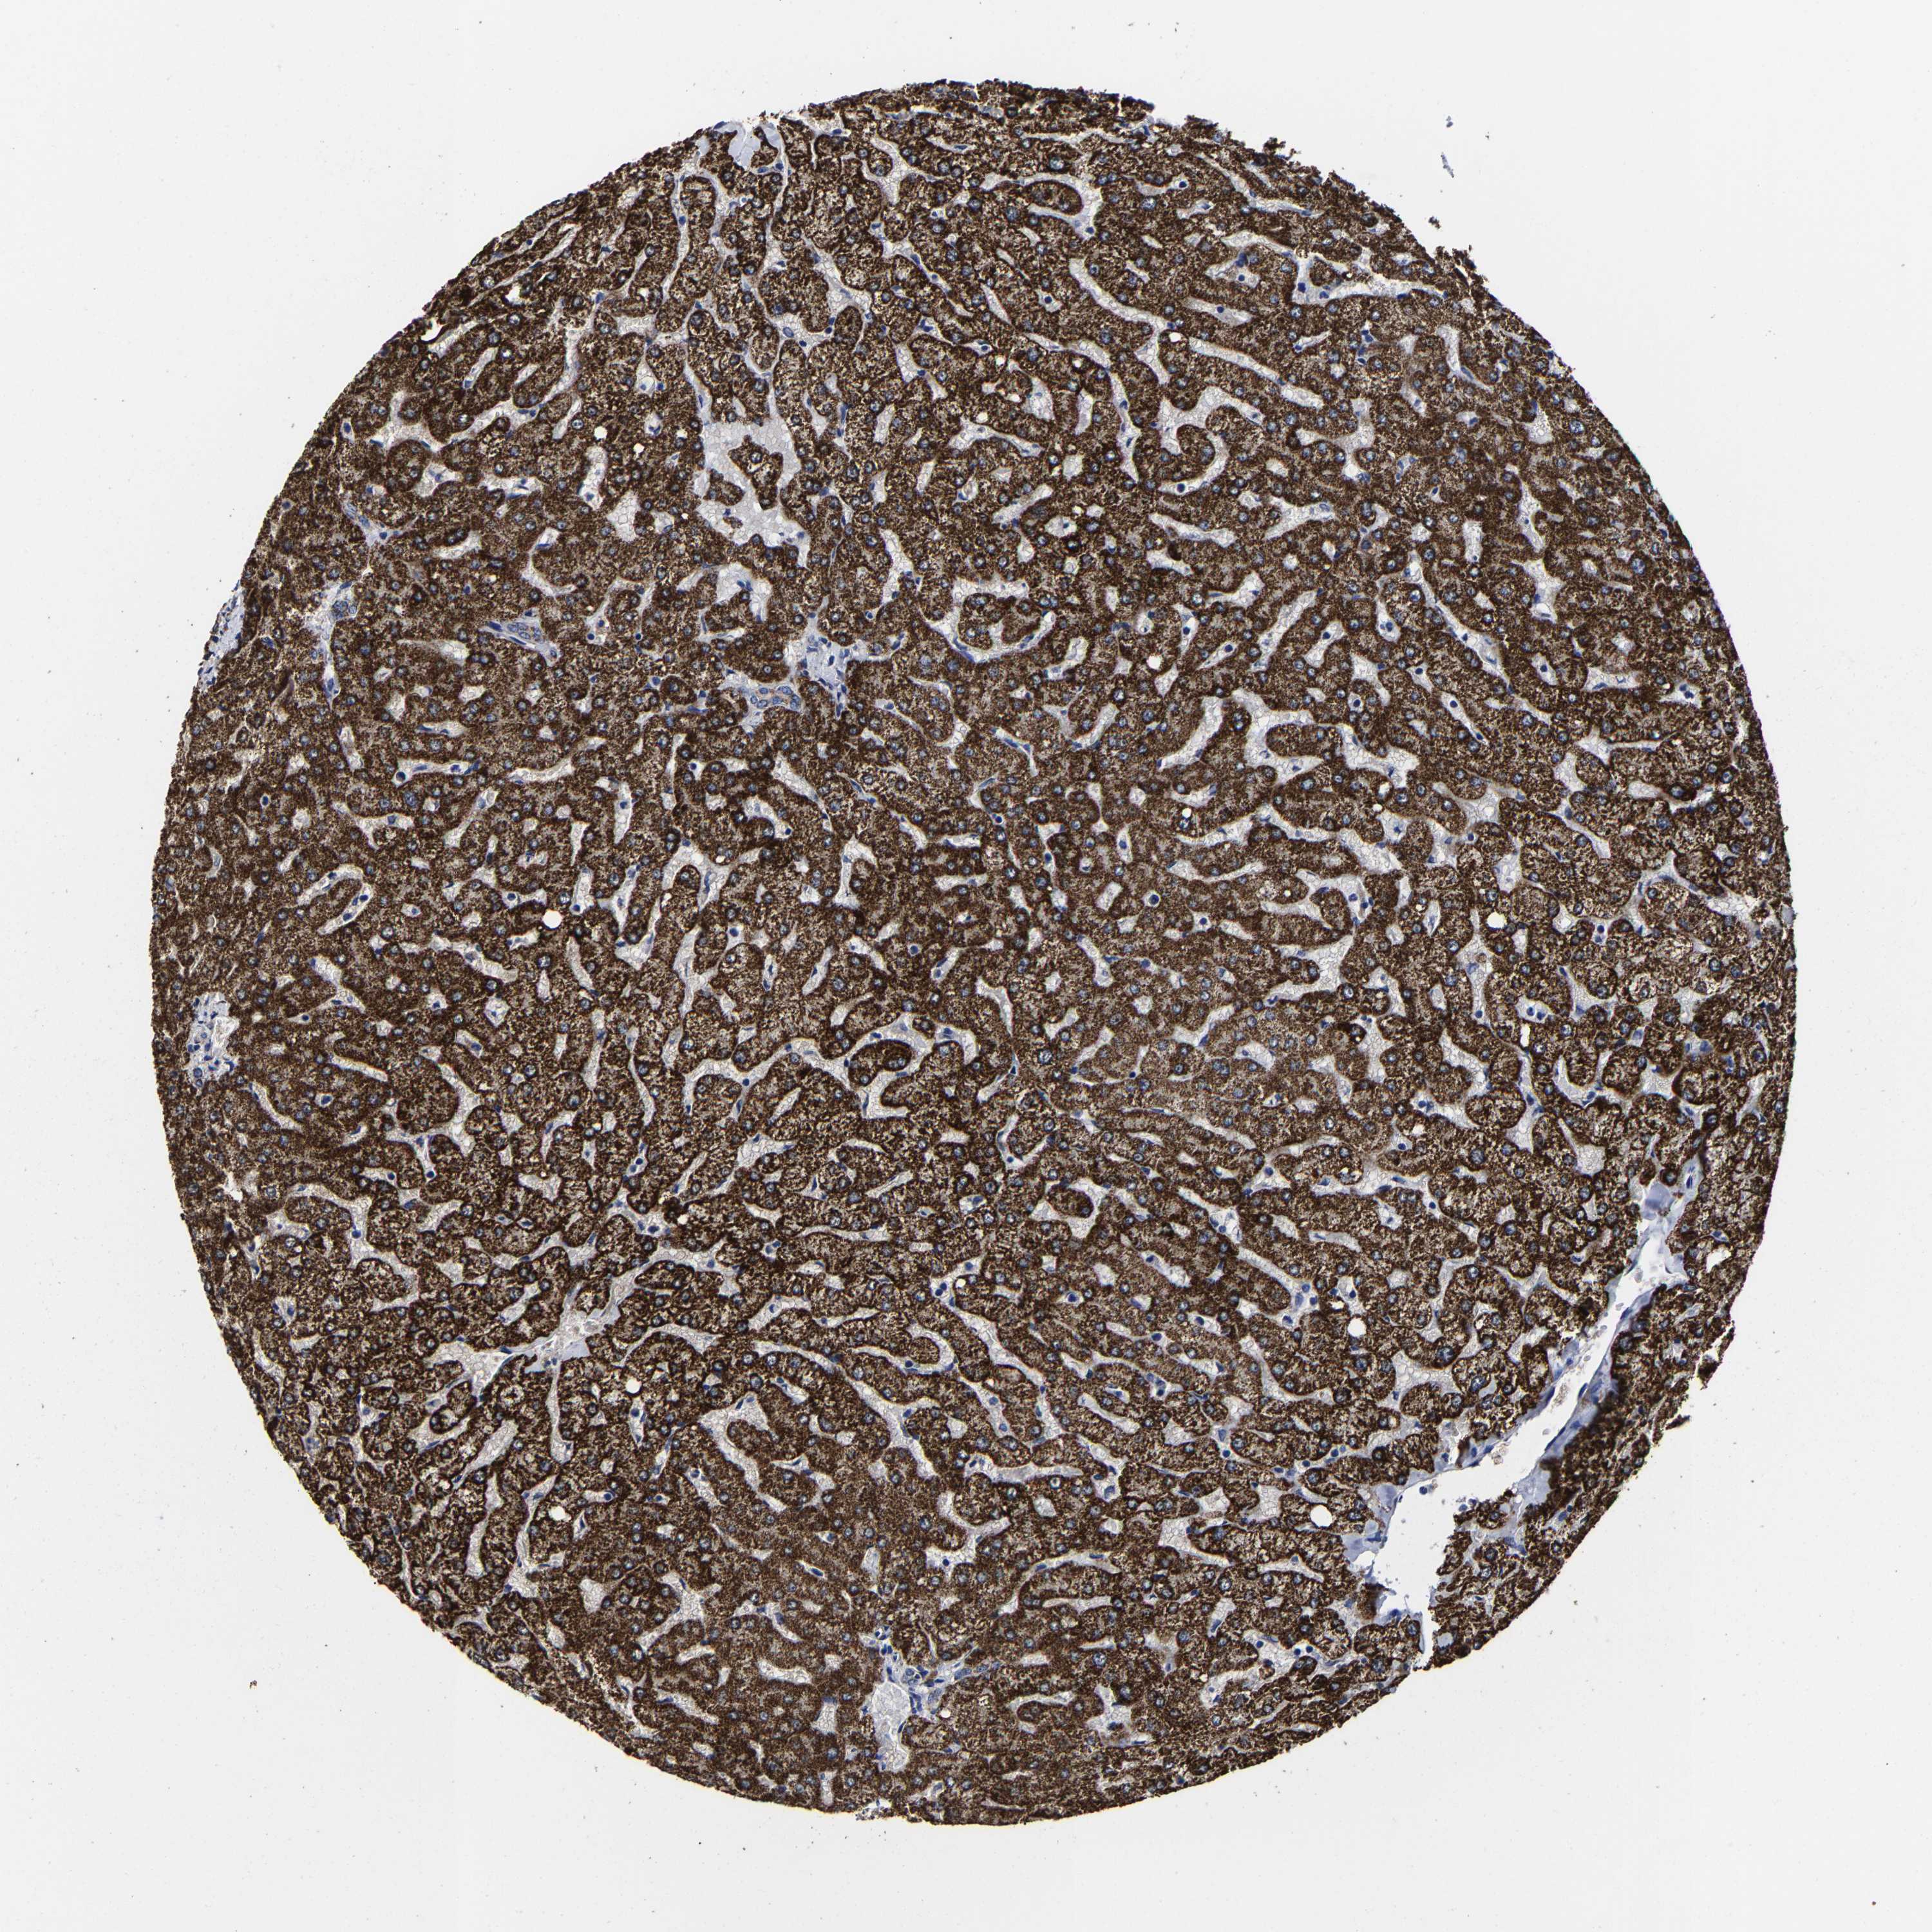
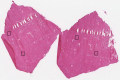
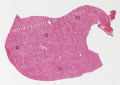
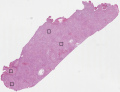
LIVER
GENE/PROTEIN
|
|
||||||||||||||||||||||||||||||||||||||||||||||||||||||||||||||||||||||||||||||||||||||||||||||||||||||||||||||||||||||||||||||||||||||||||||||||||||||||||||||||||||||||||||||||||||||||||||||||||||||||||||||||||||||||
The Project
The Human Protein Atlas


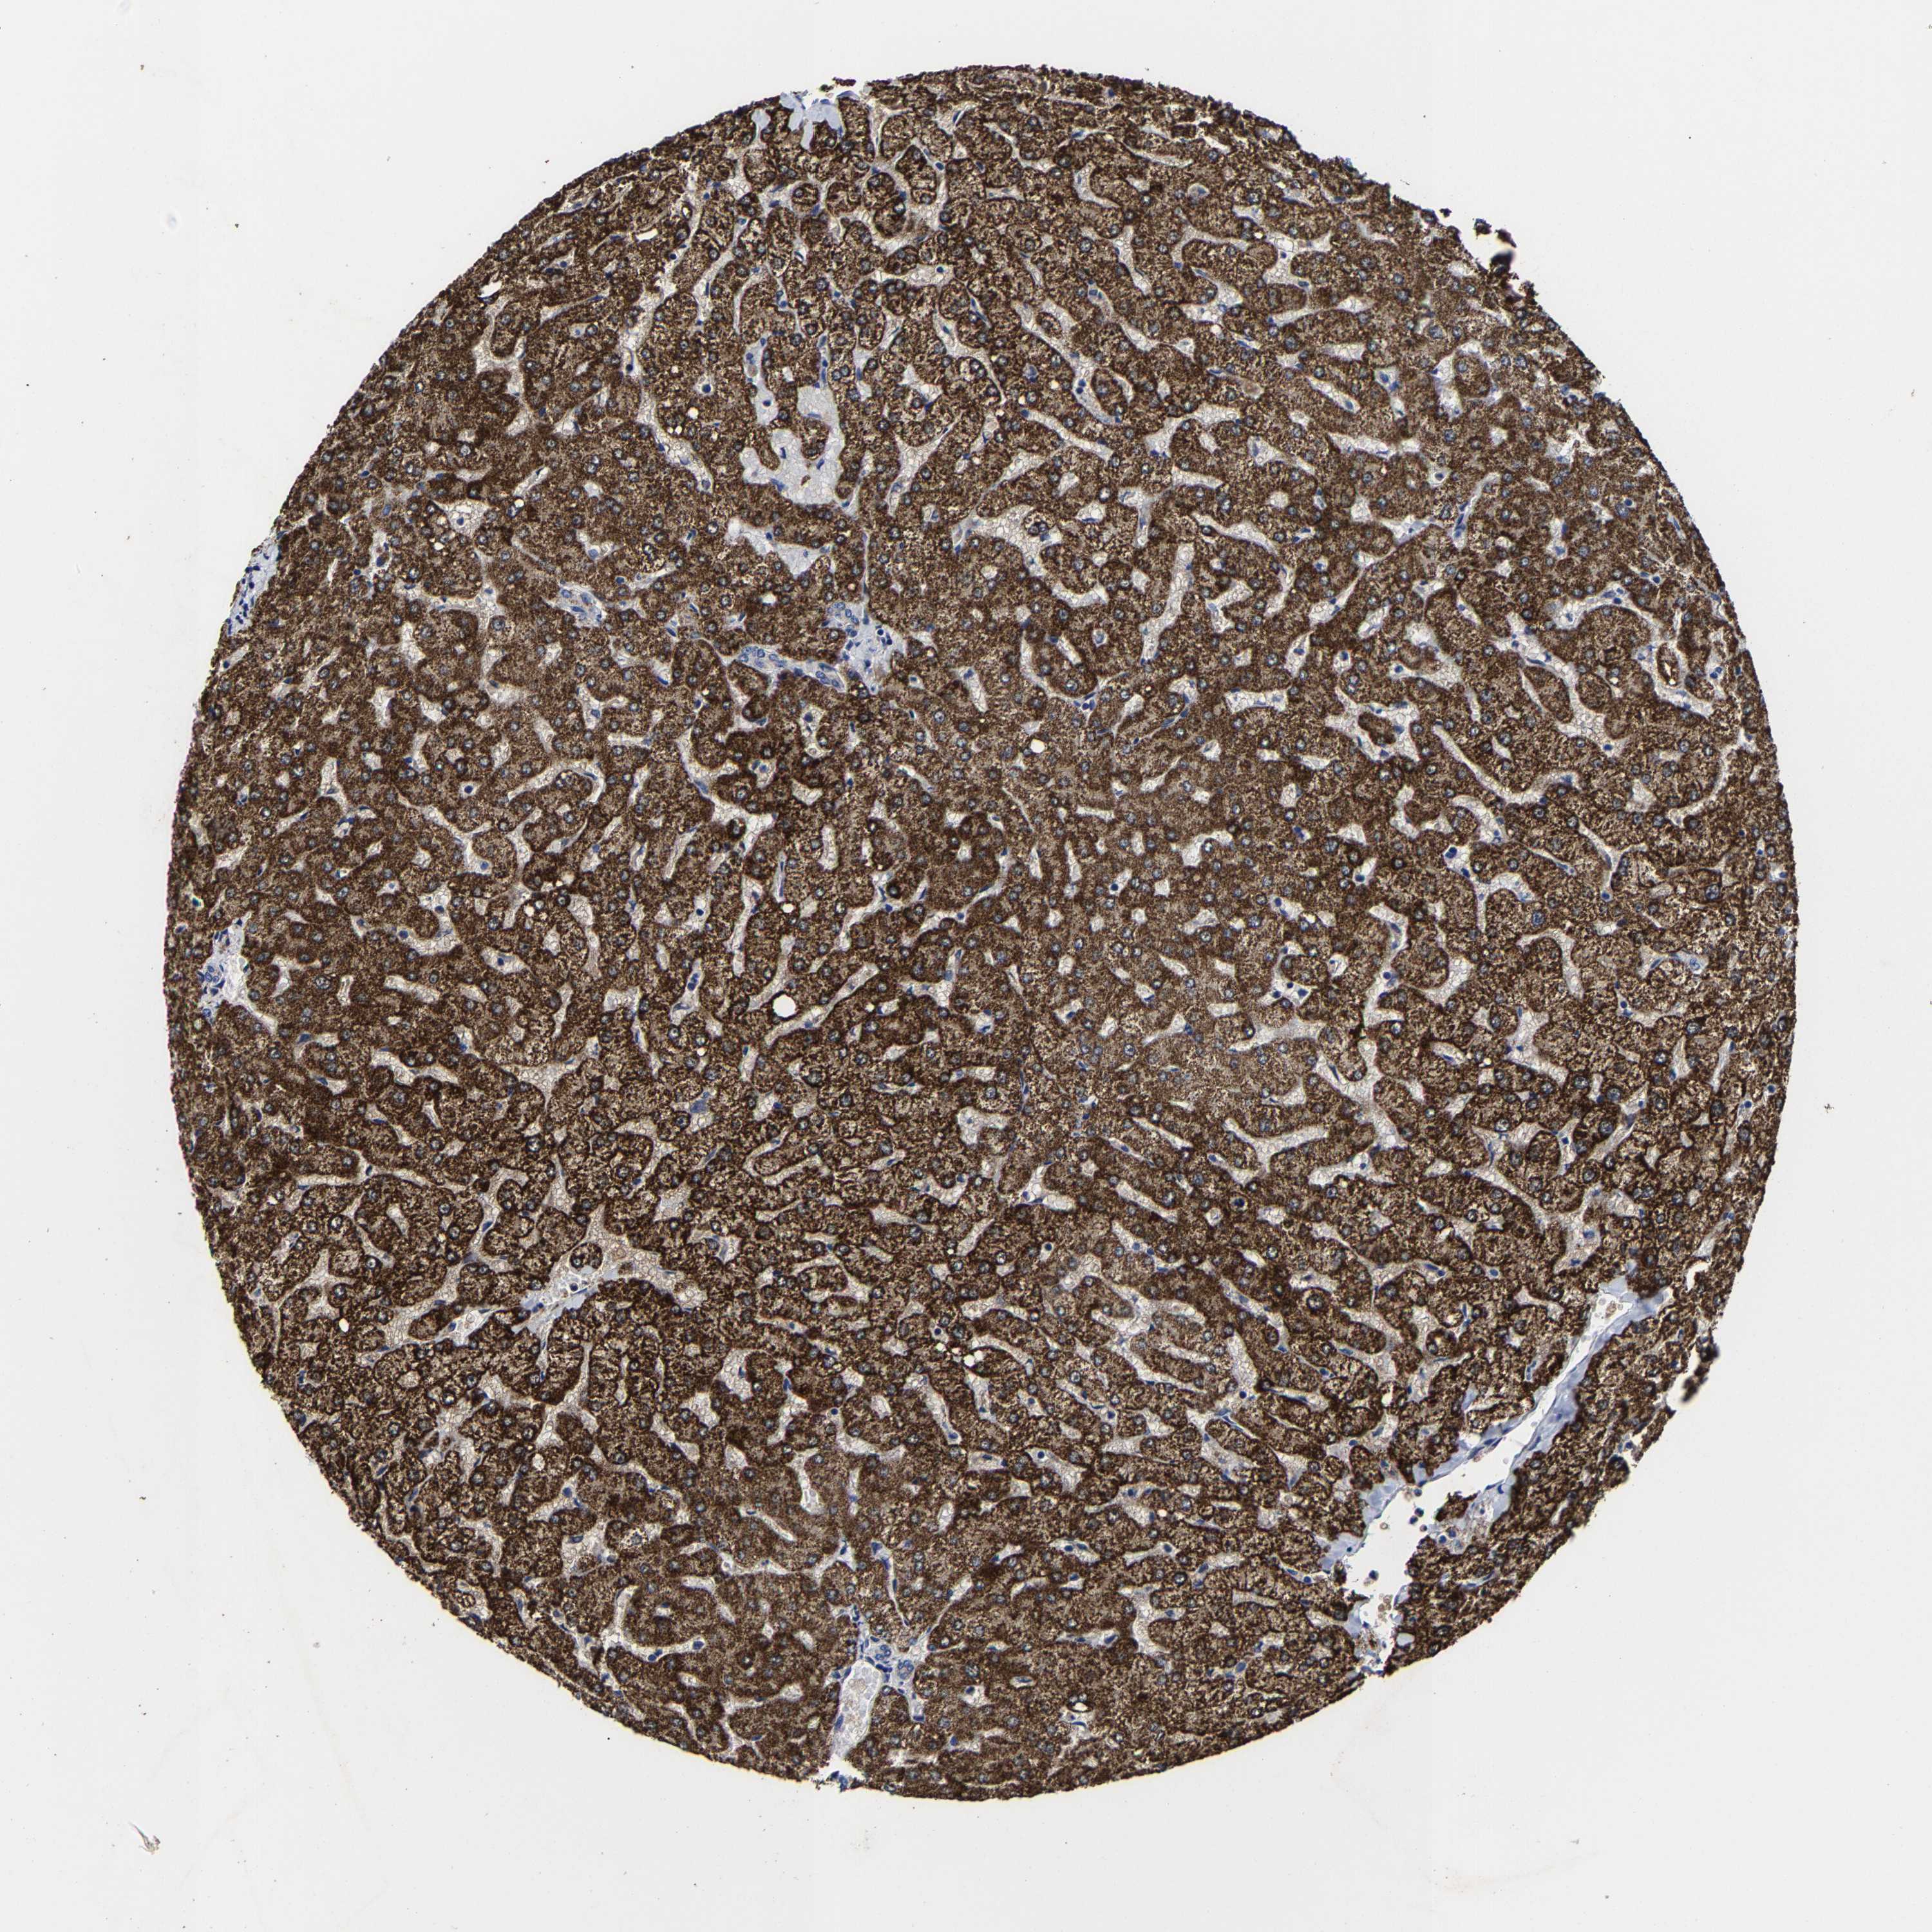
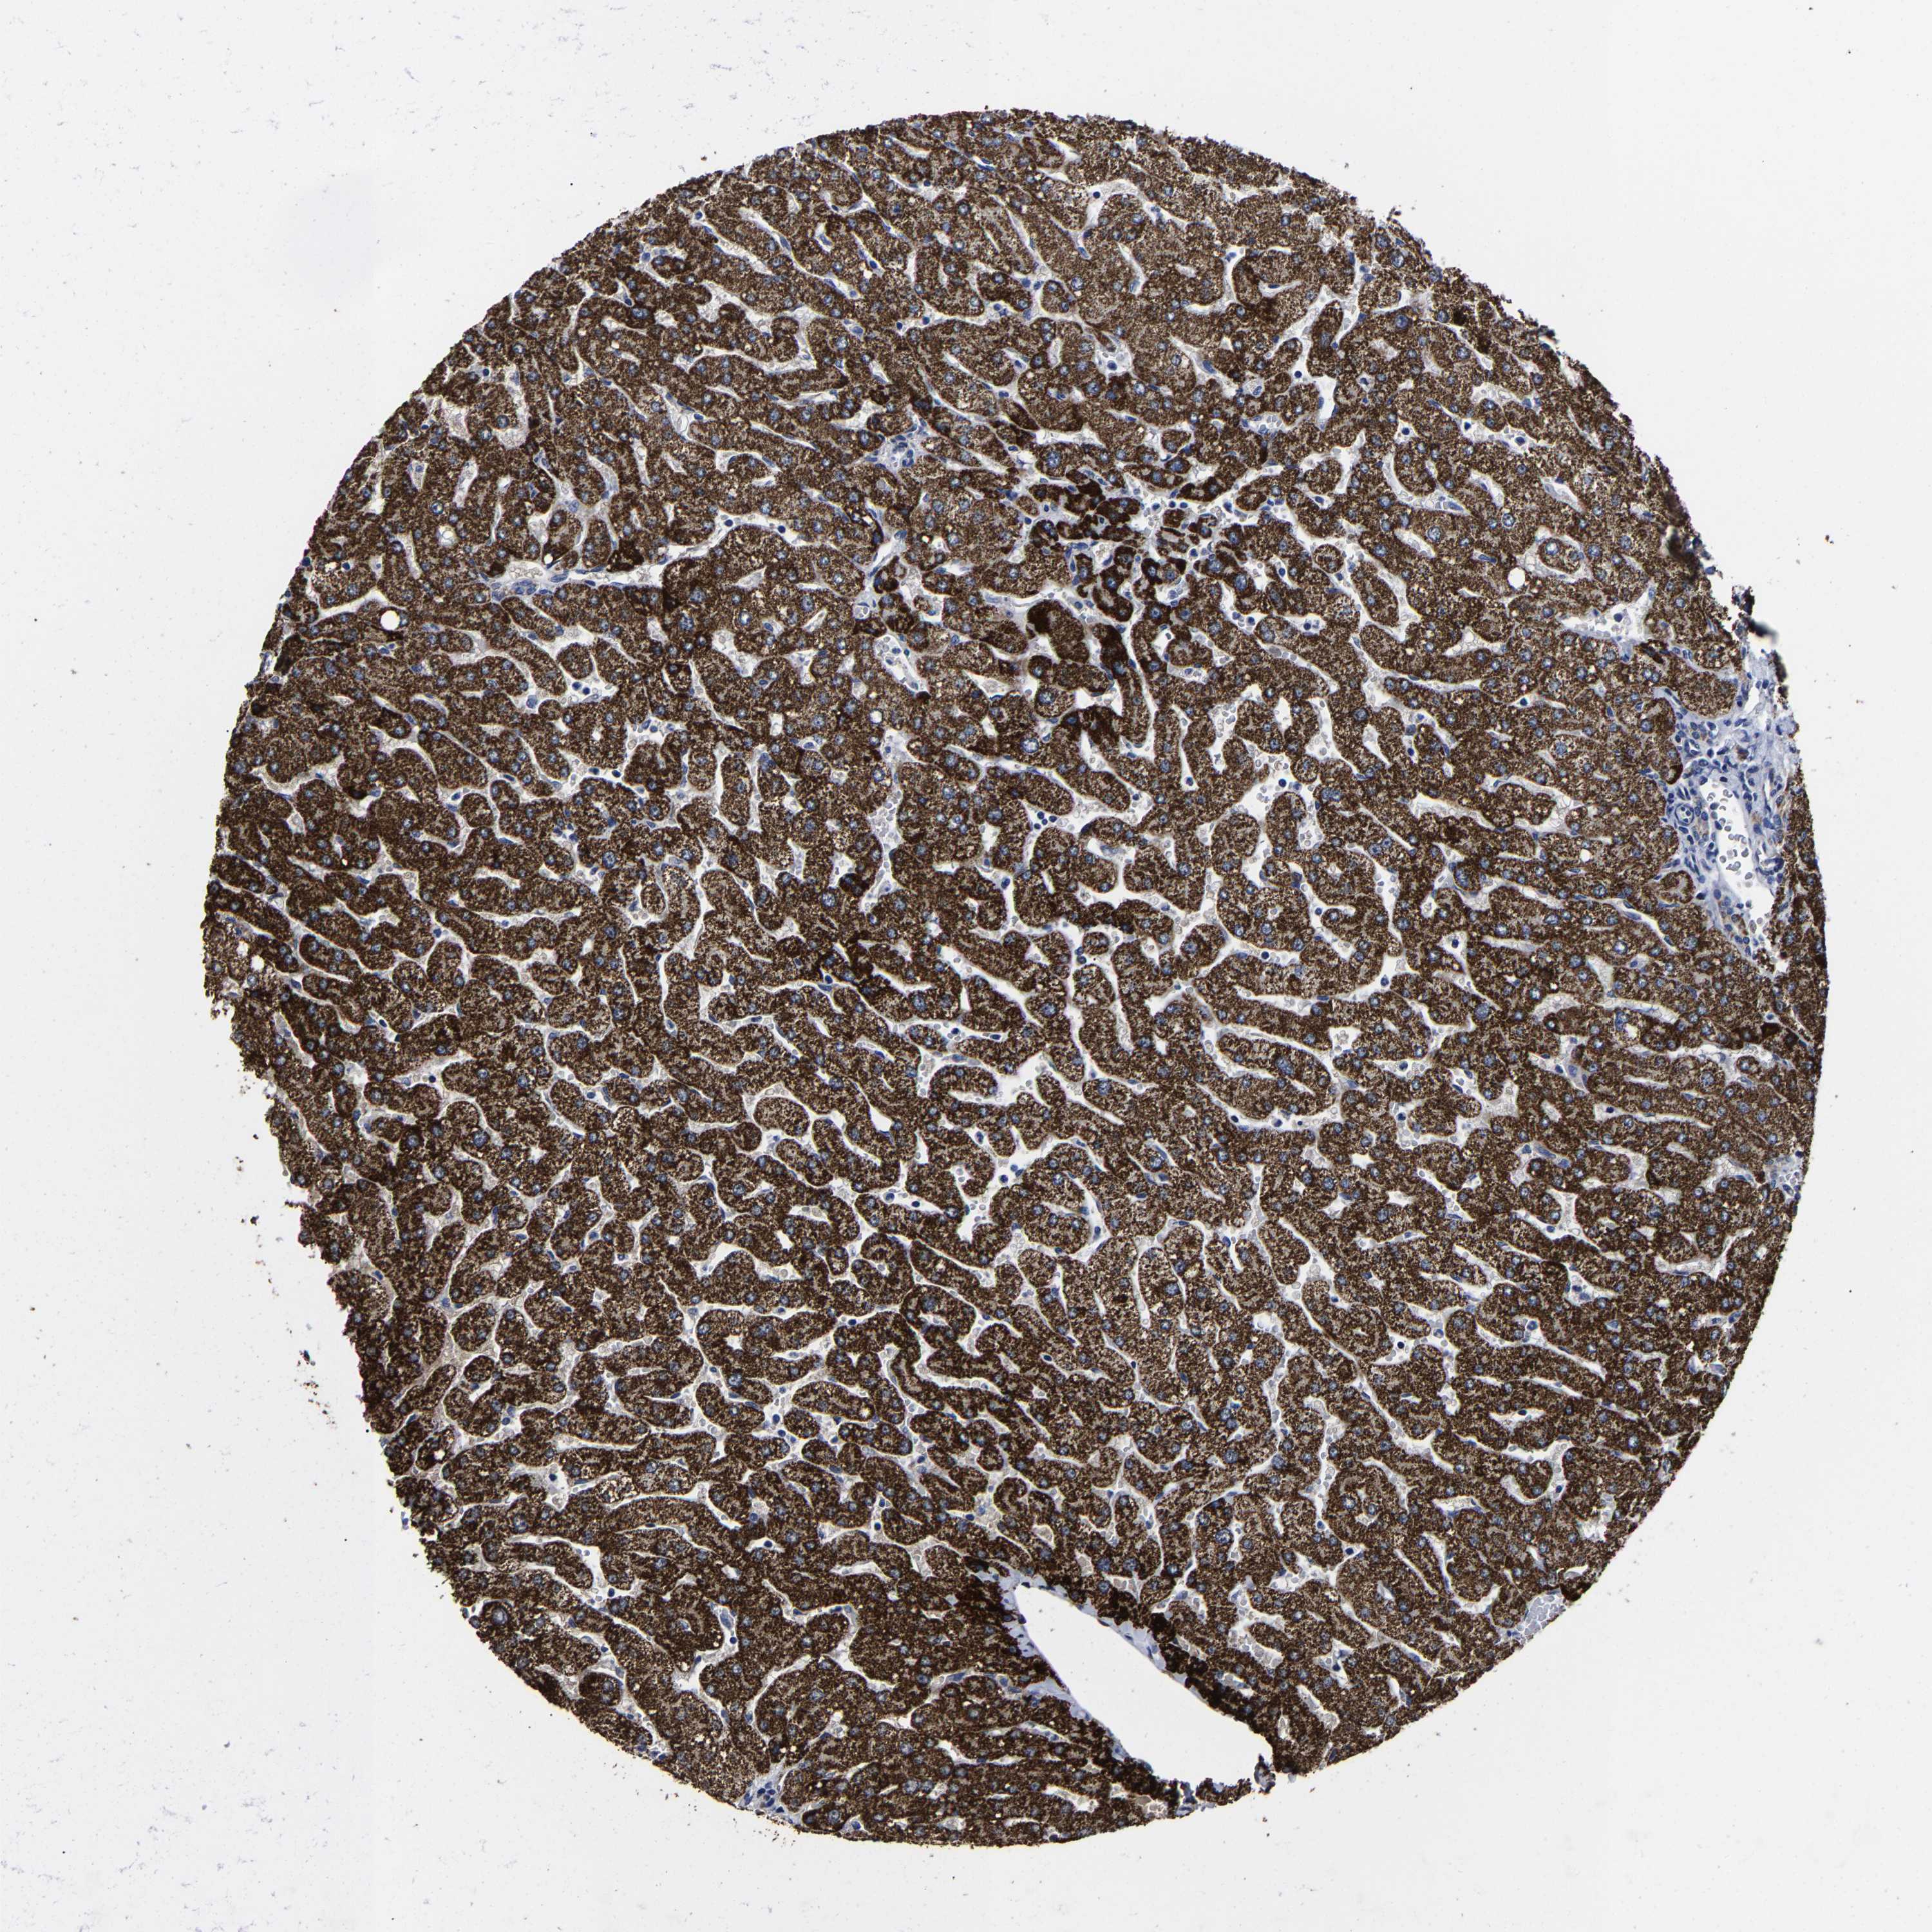


 Female, age 60
 Male, age 54
 Male, age 74
 Female, age 62
 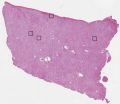 Male, age 78
 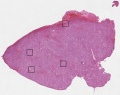 Male, age 53
  Male, age 77
 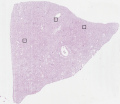 Female, age 72
 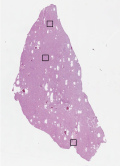 Male, age 70
 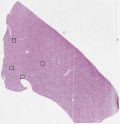 Female, age 23


