TISSUE
CELL
CANCER
Antibody validation
Dictionary
VAGINA - Expression summary
Protein expression
RNA expression
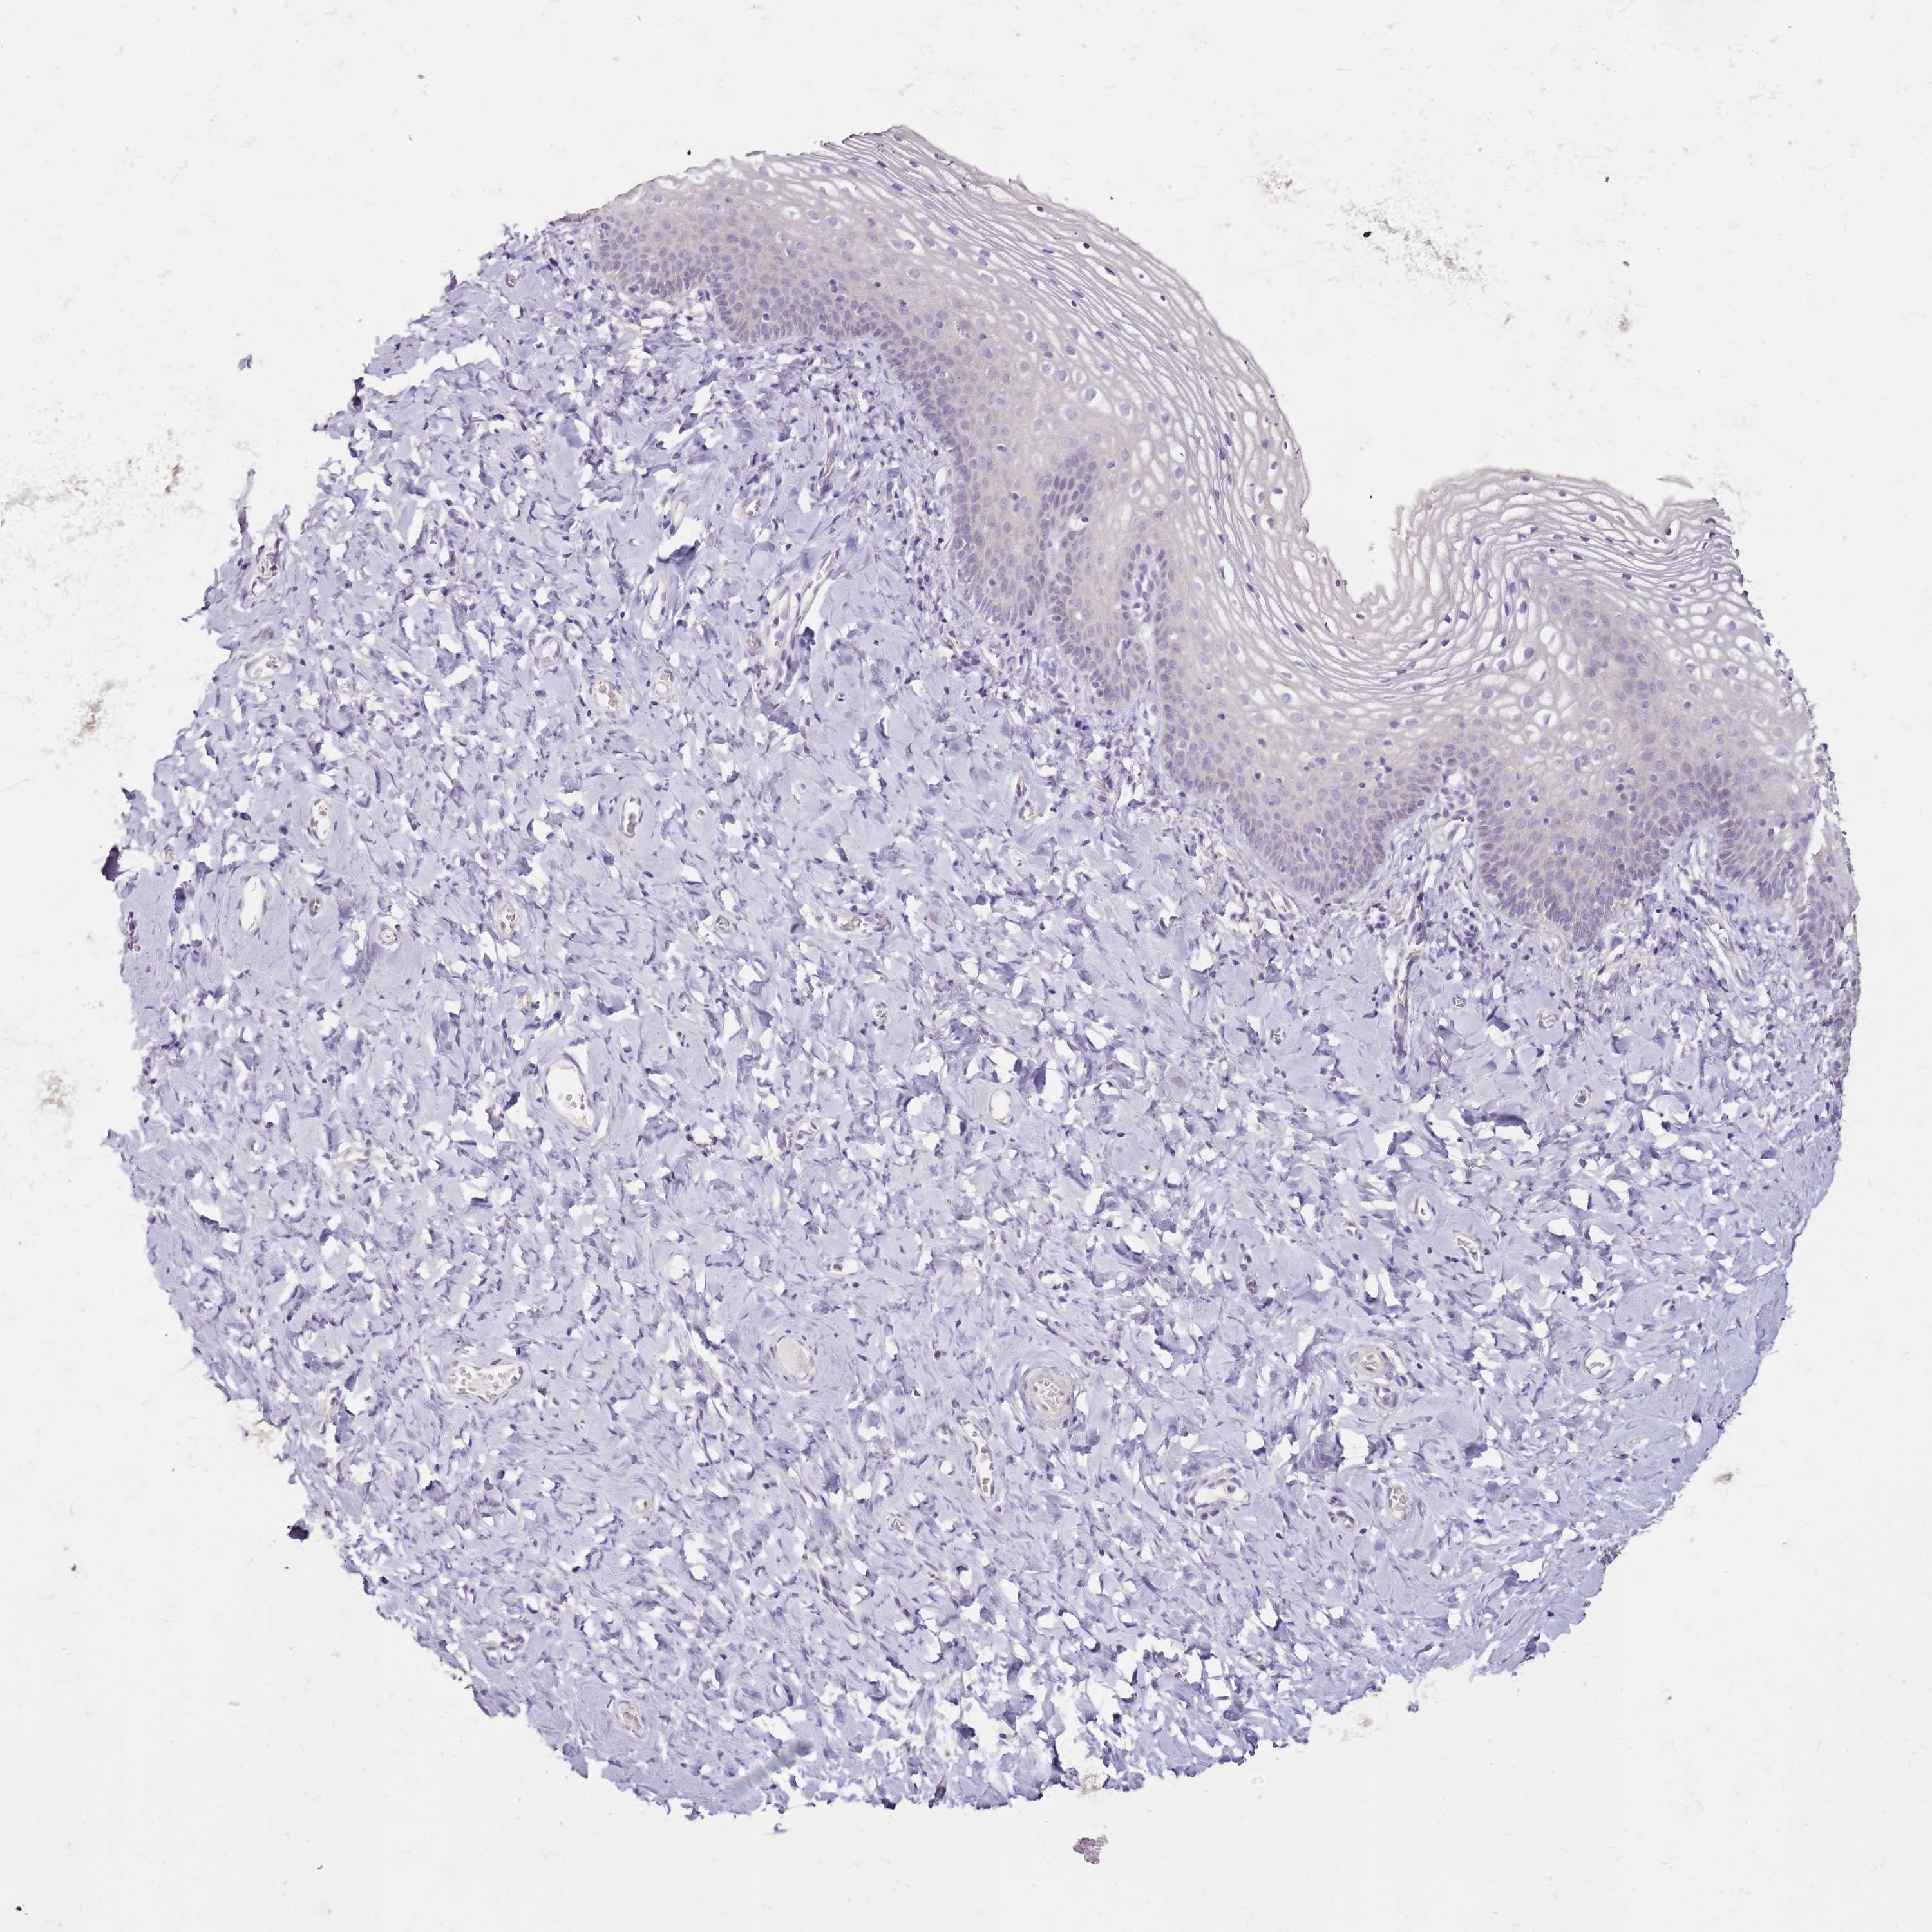
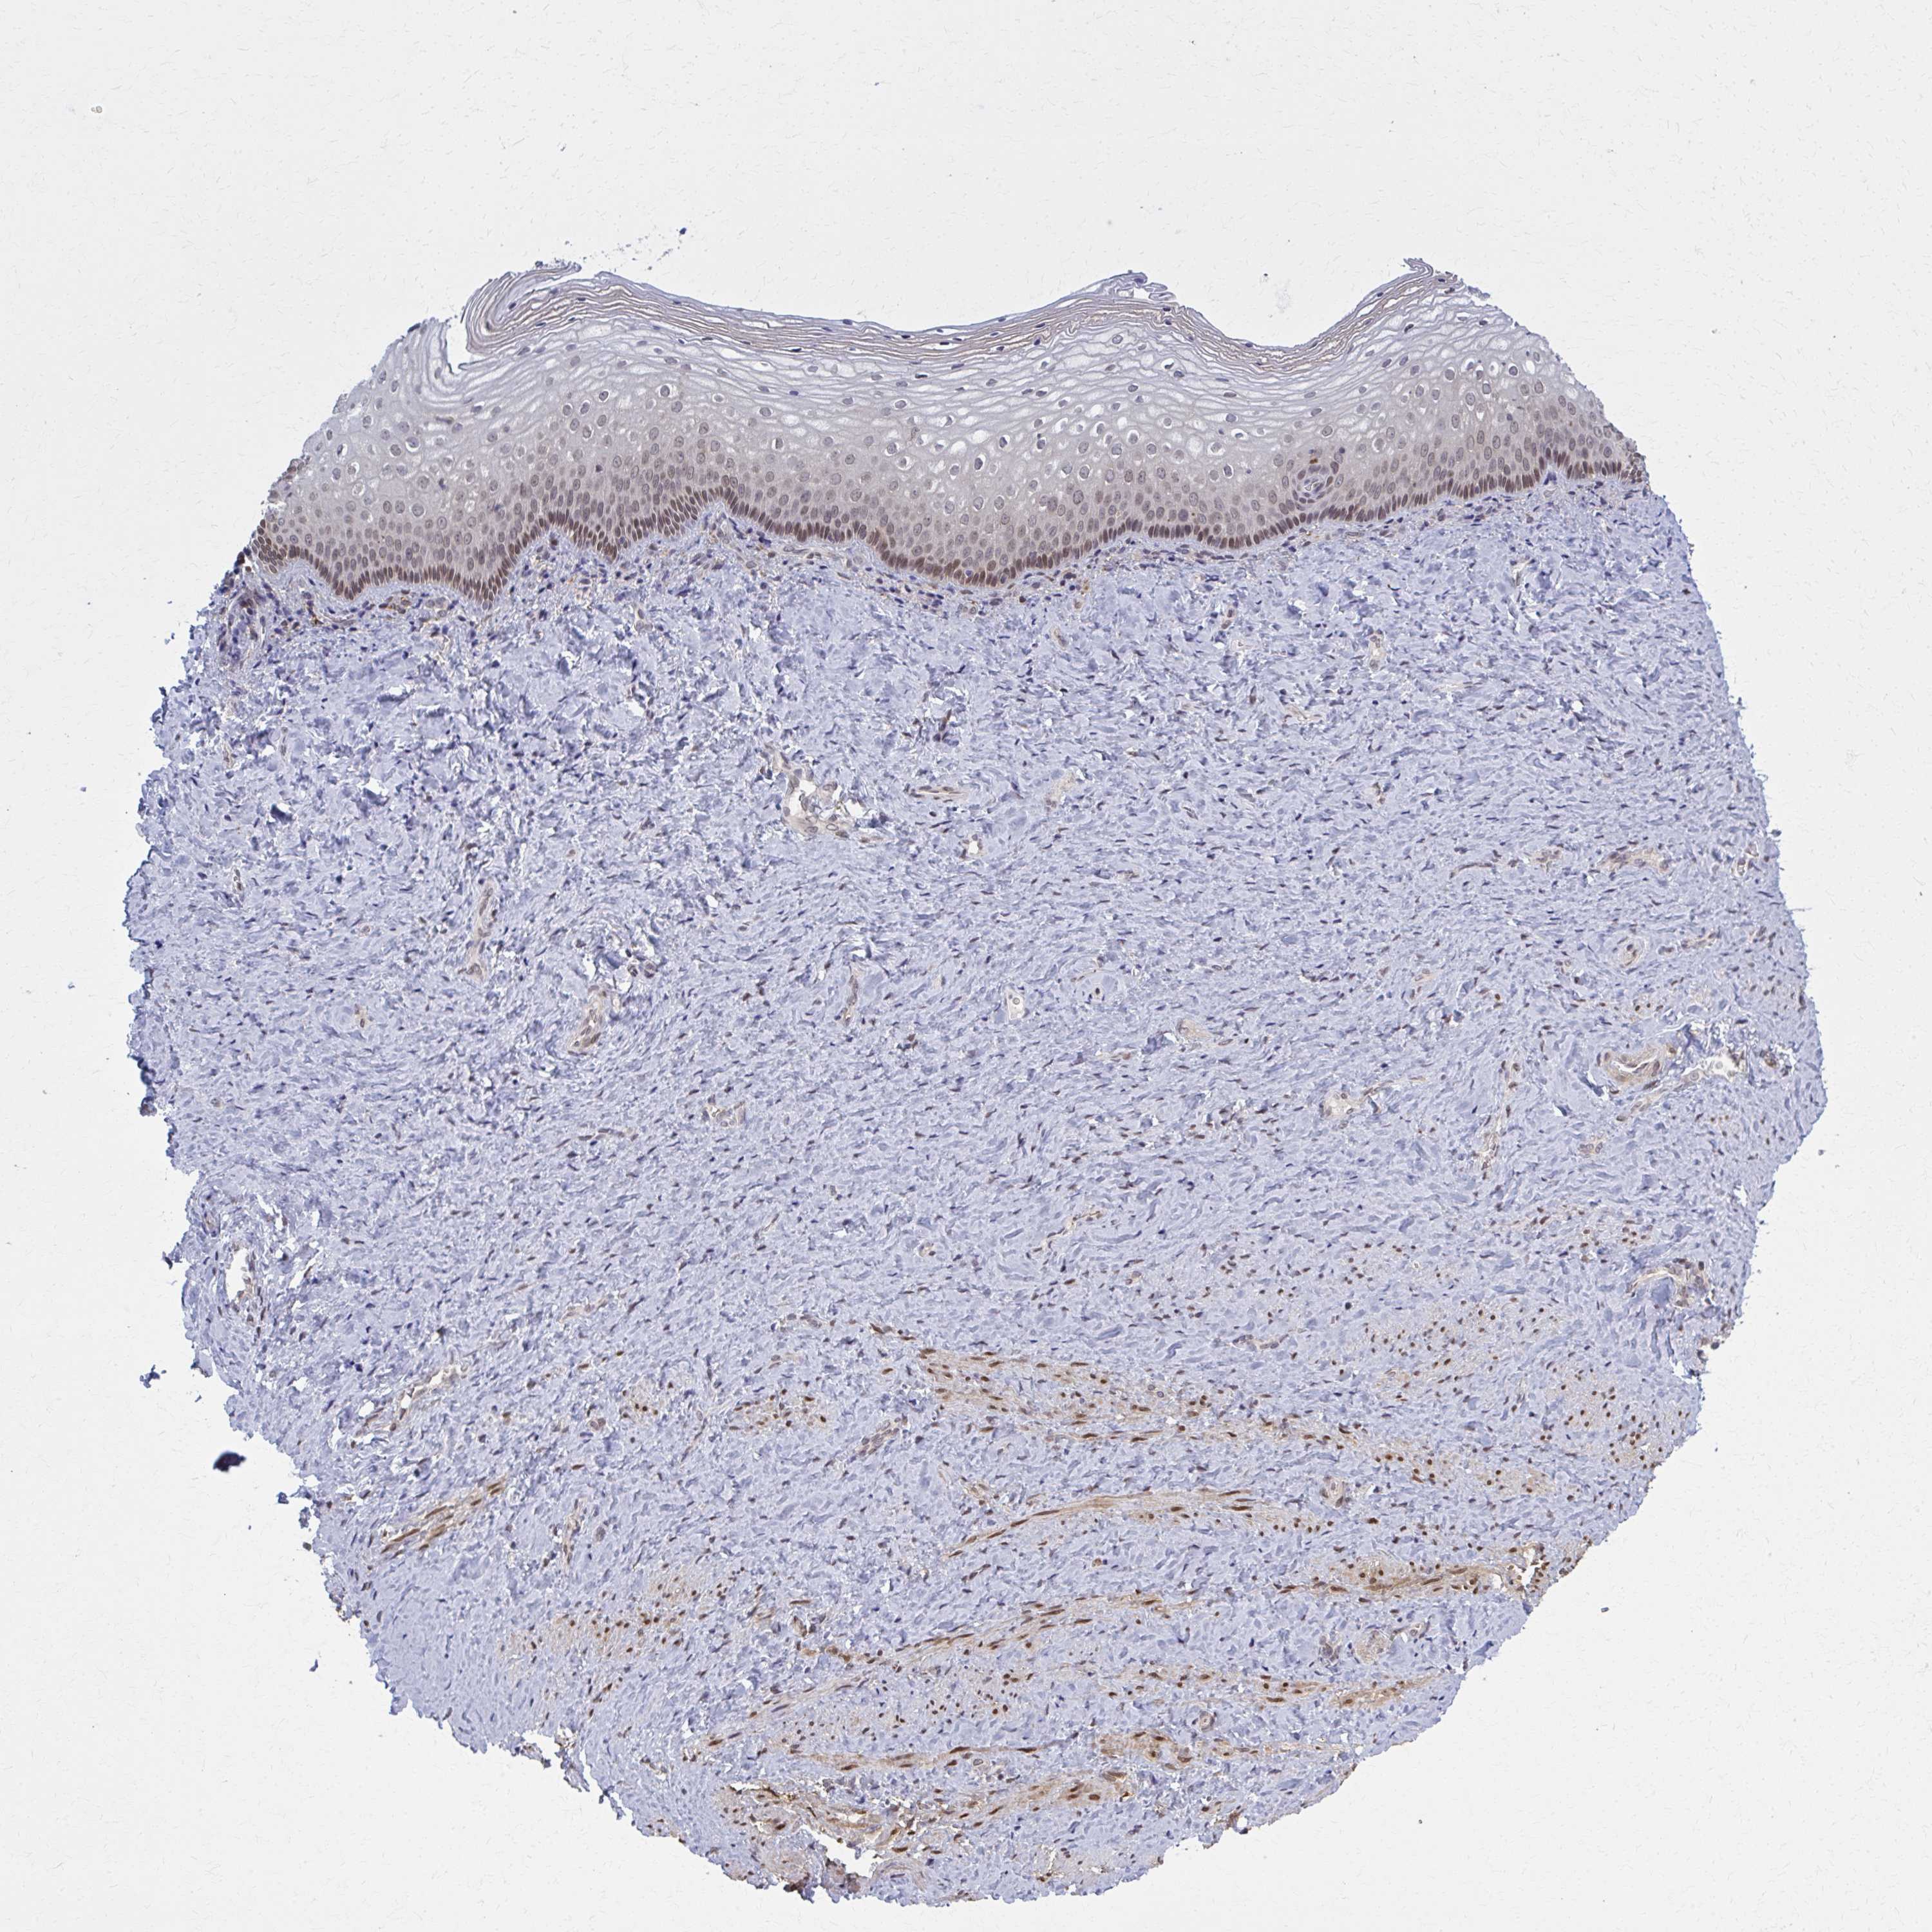
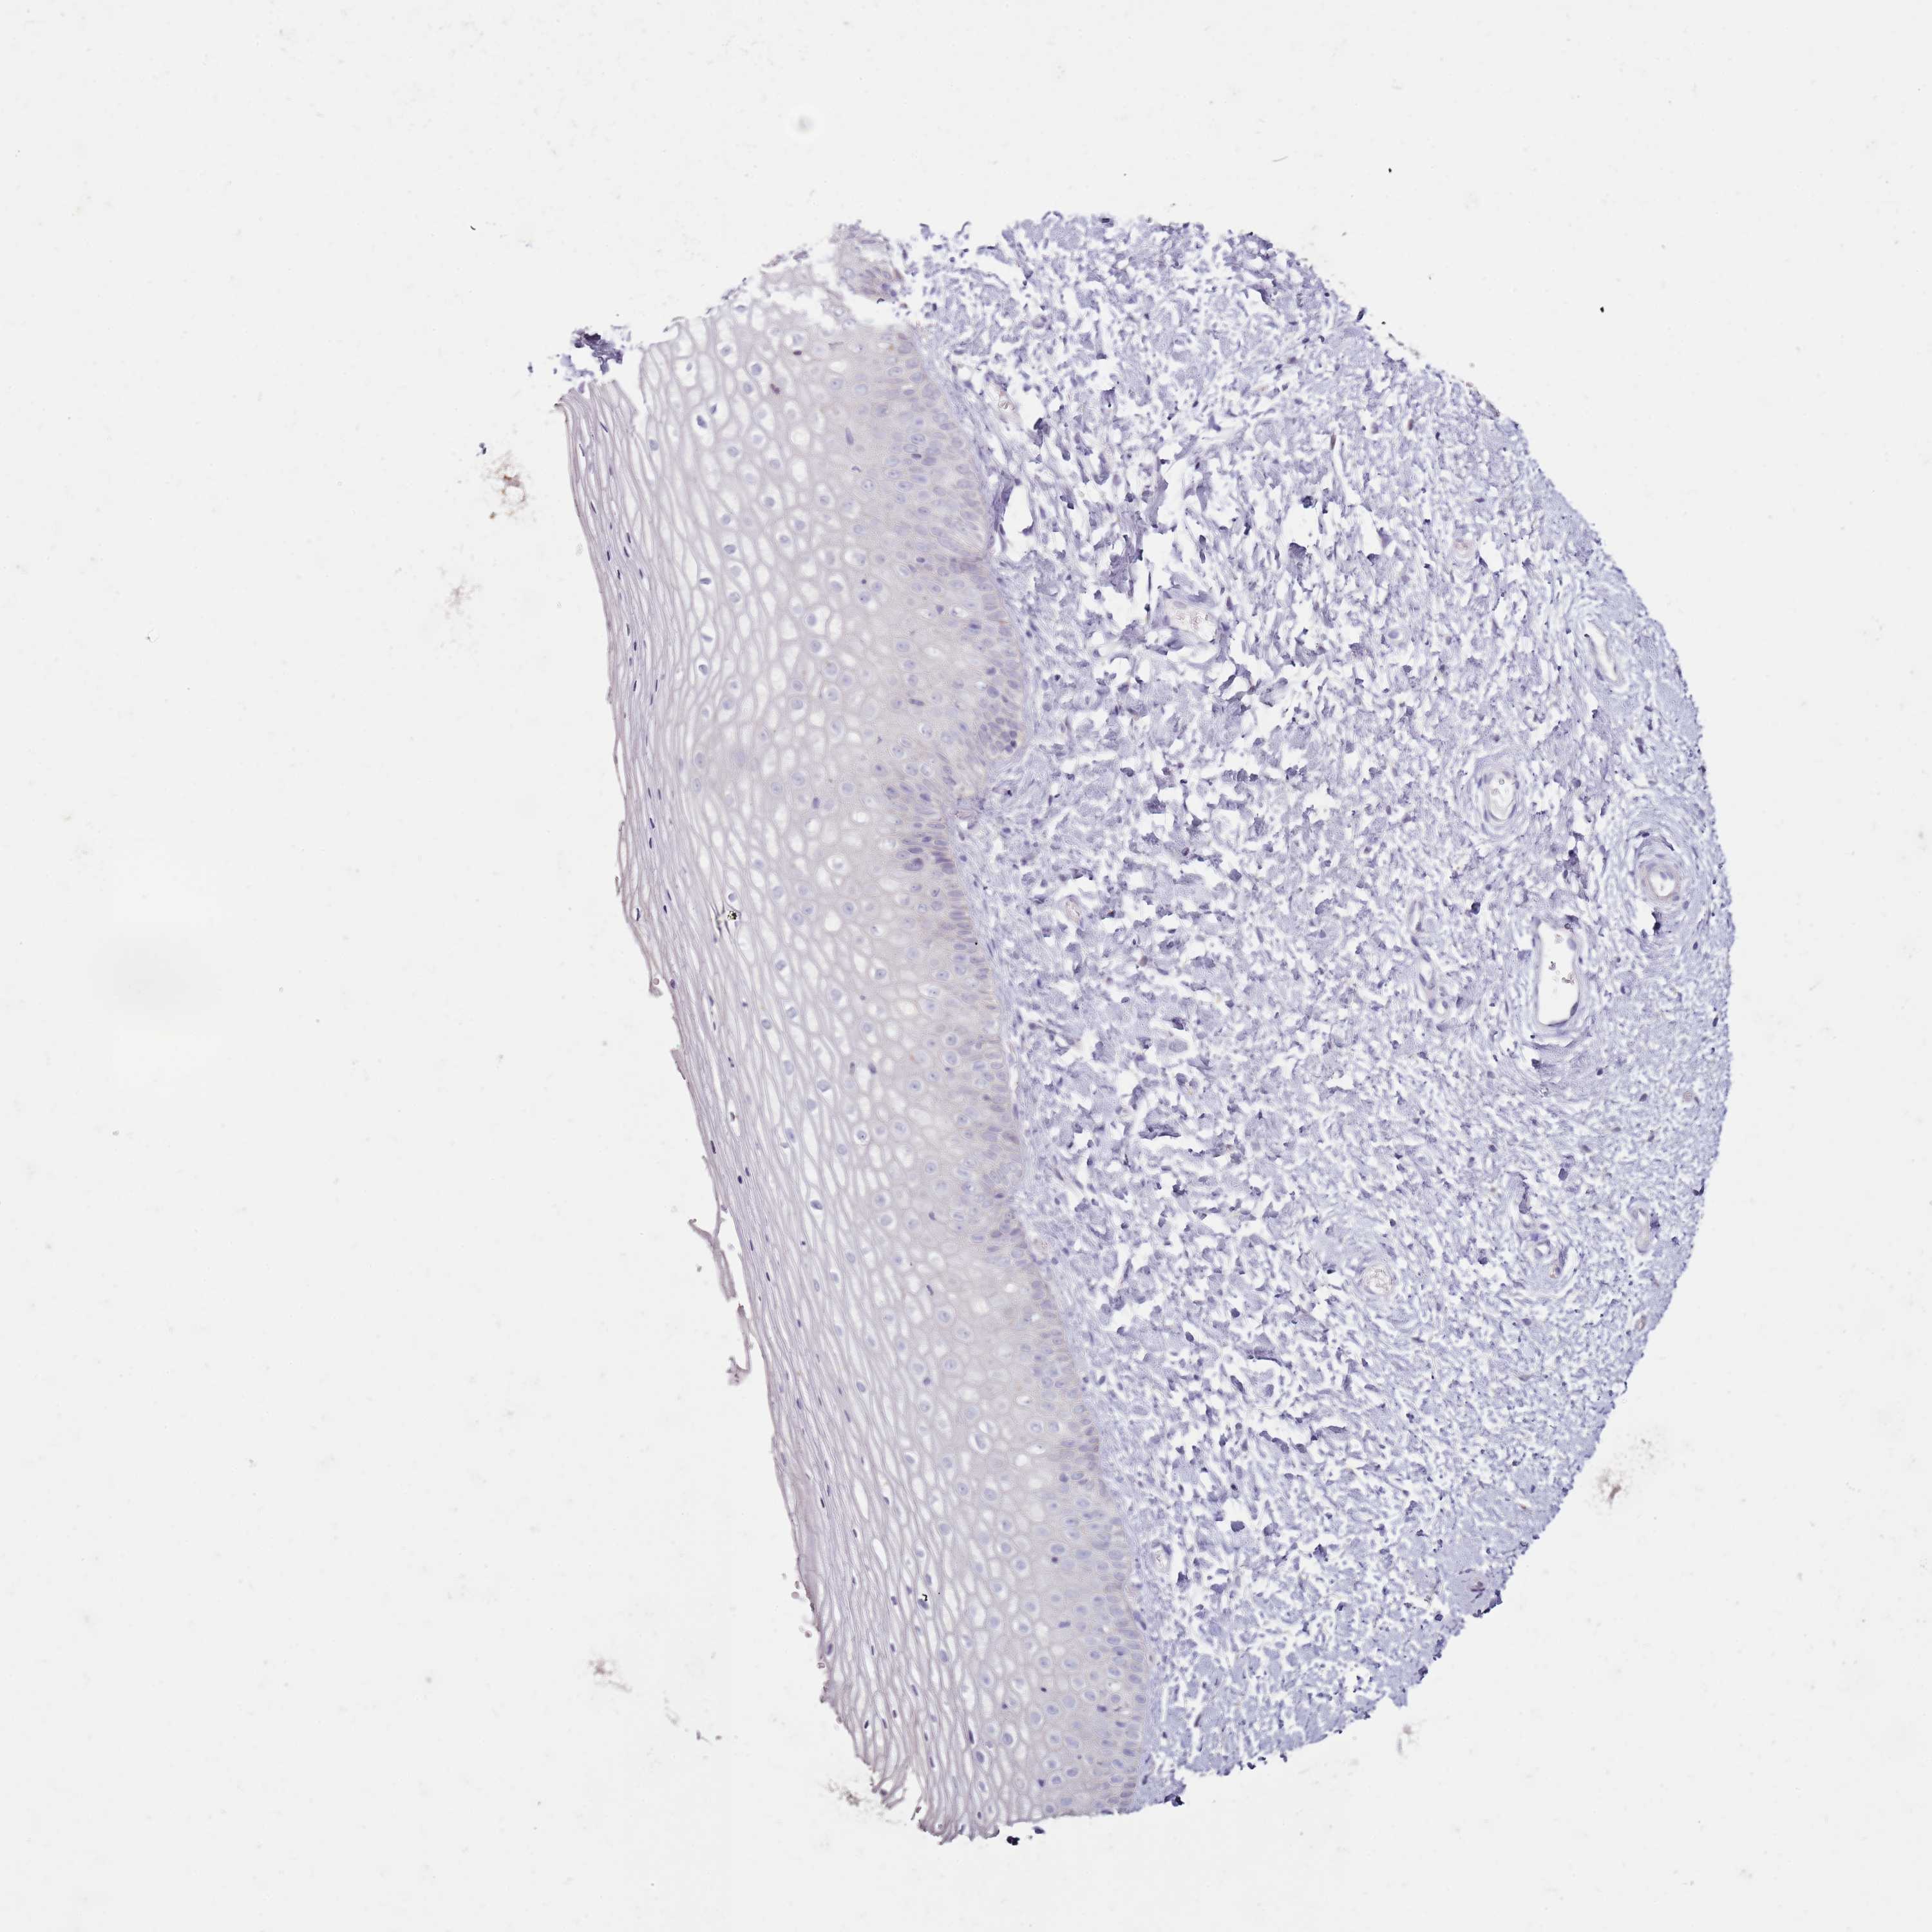
VAGINA - Annotated protein expression
Annotated proteinexpression
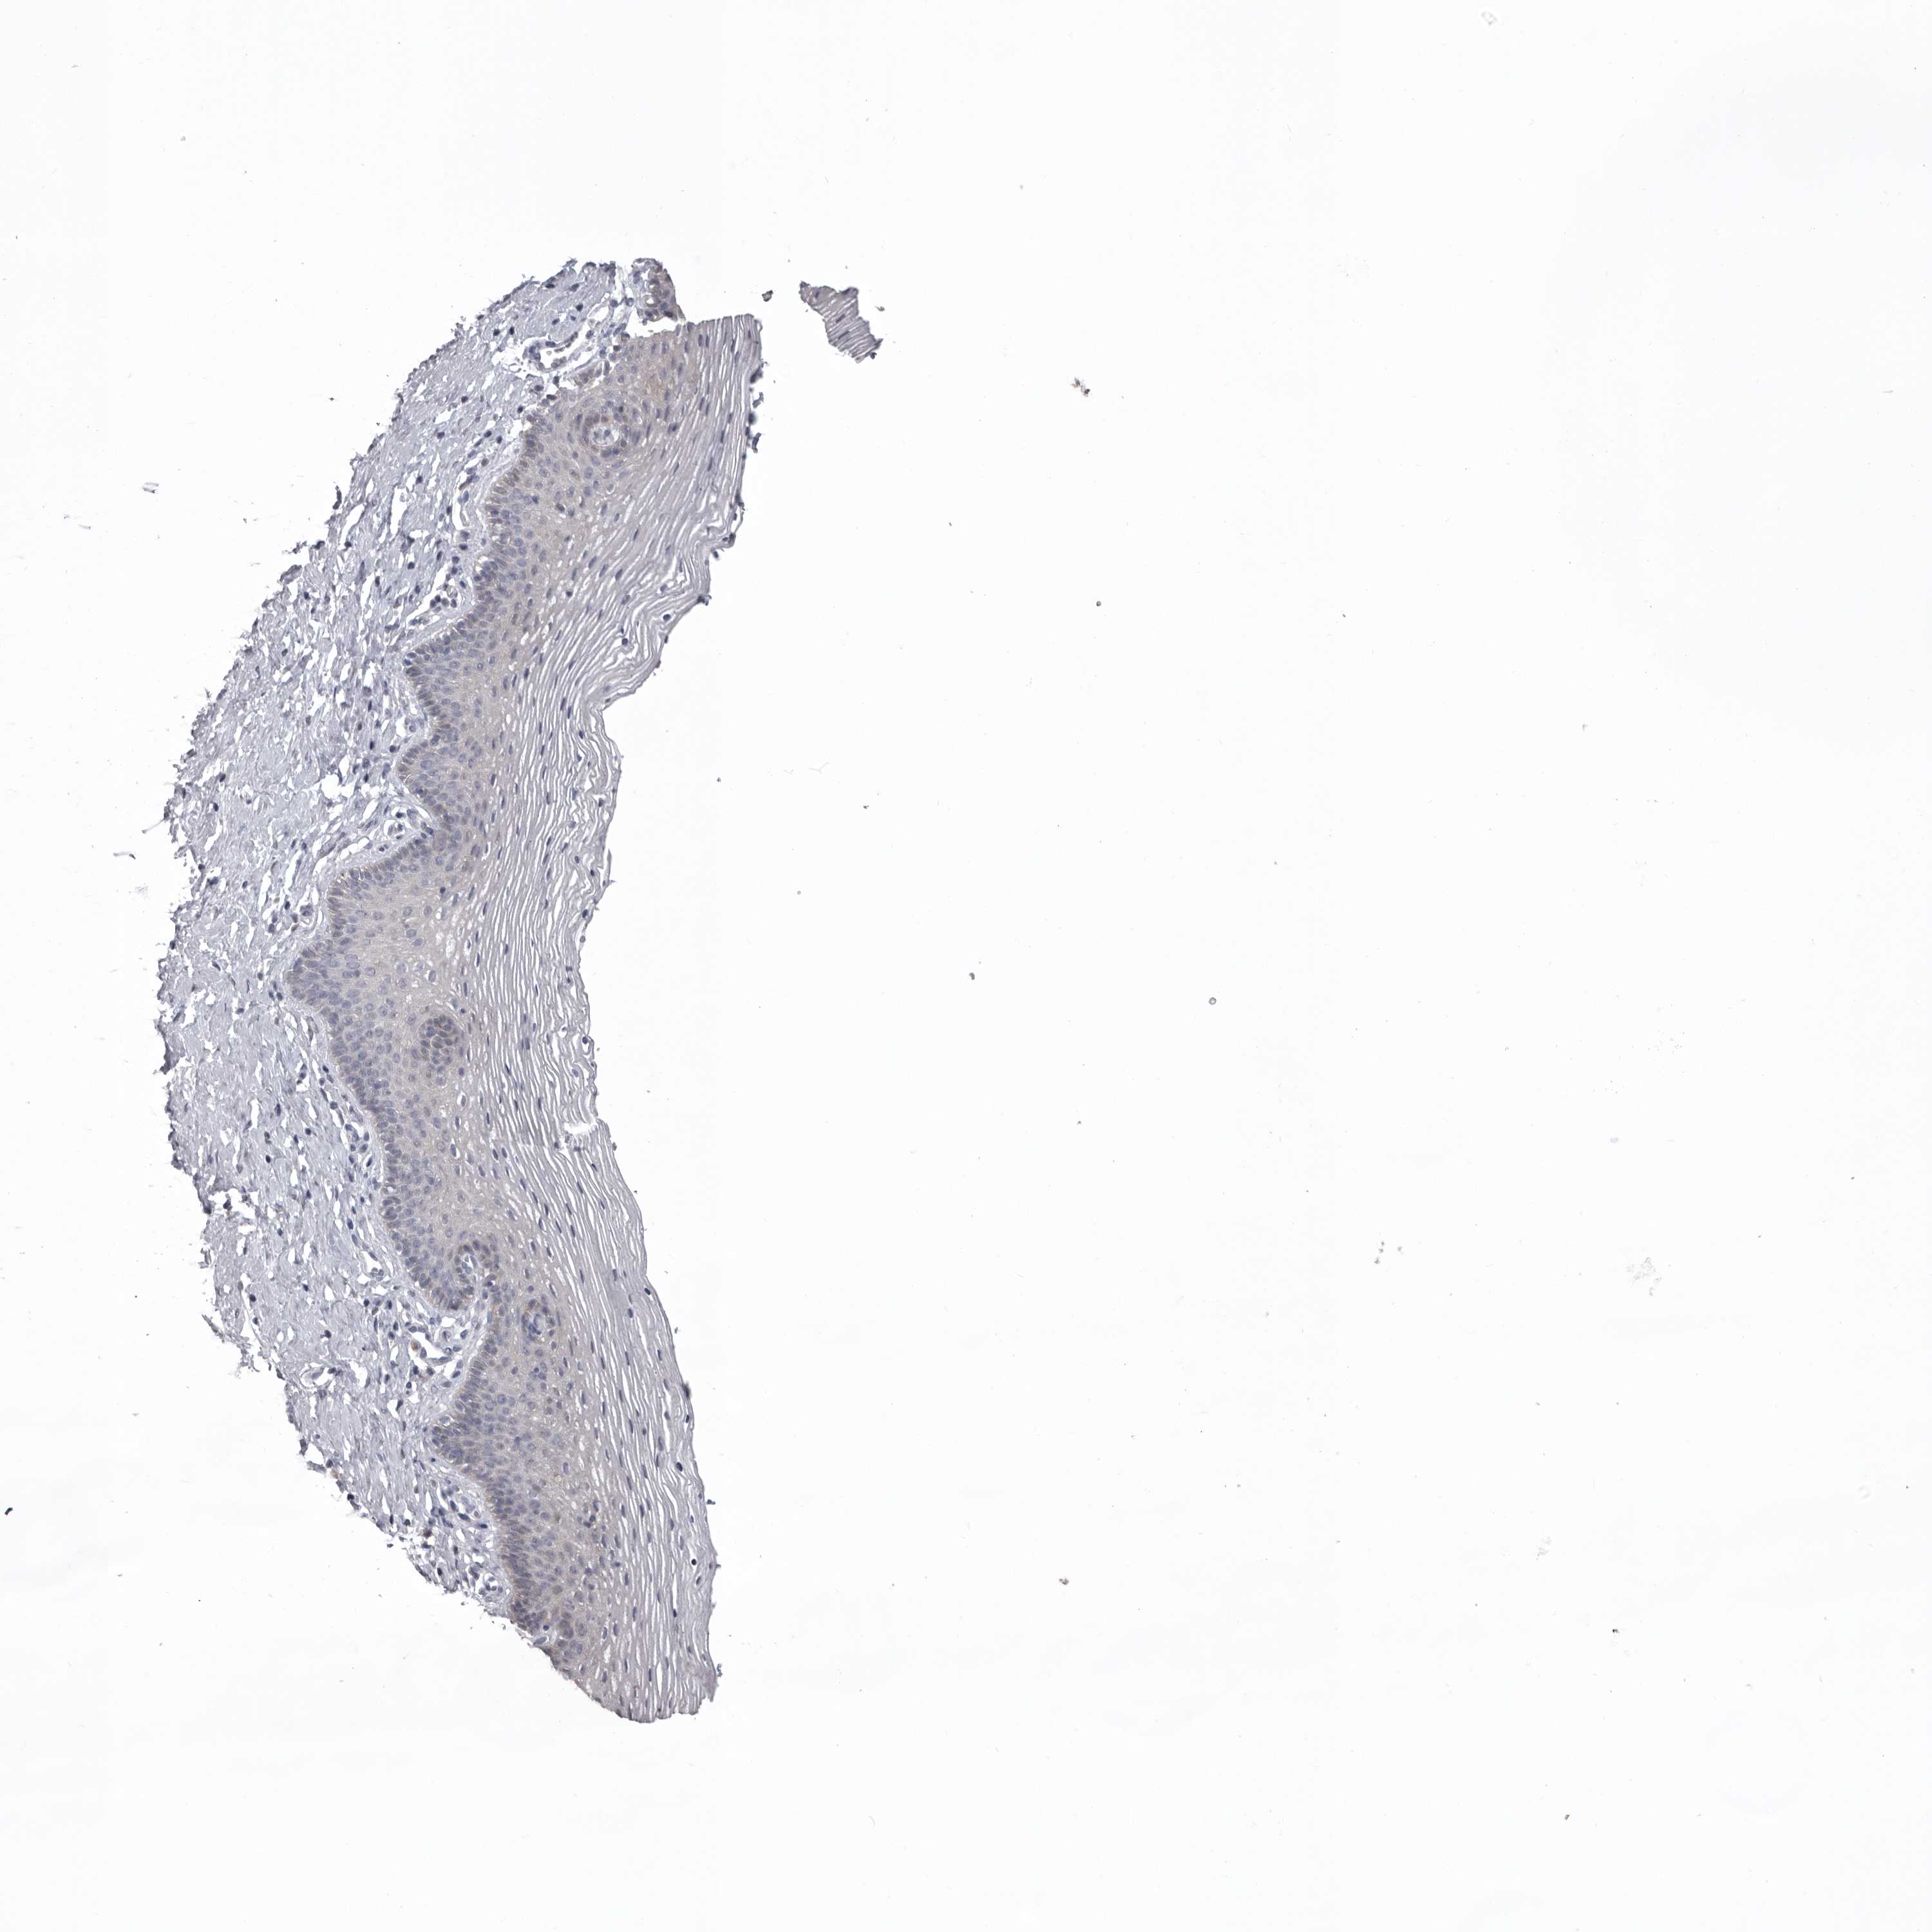
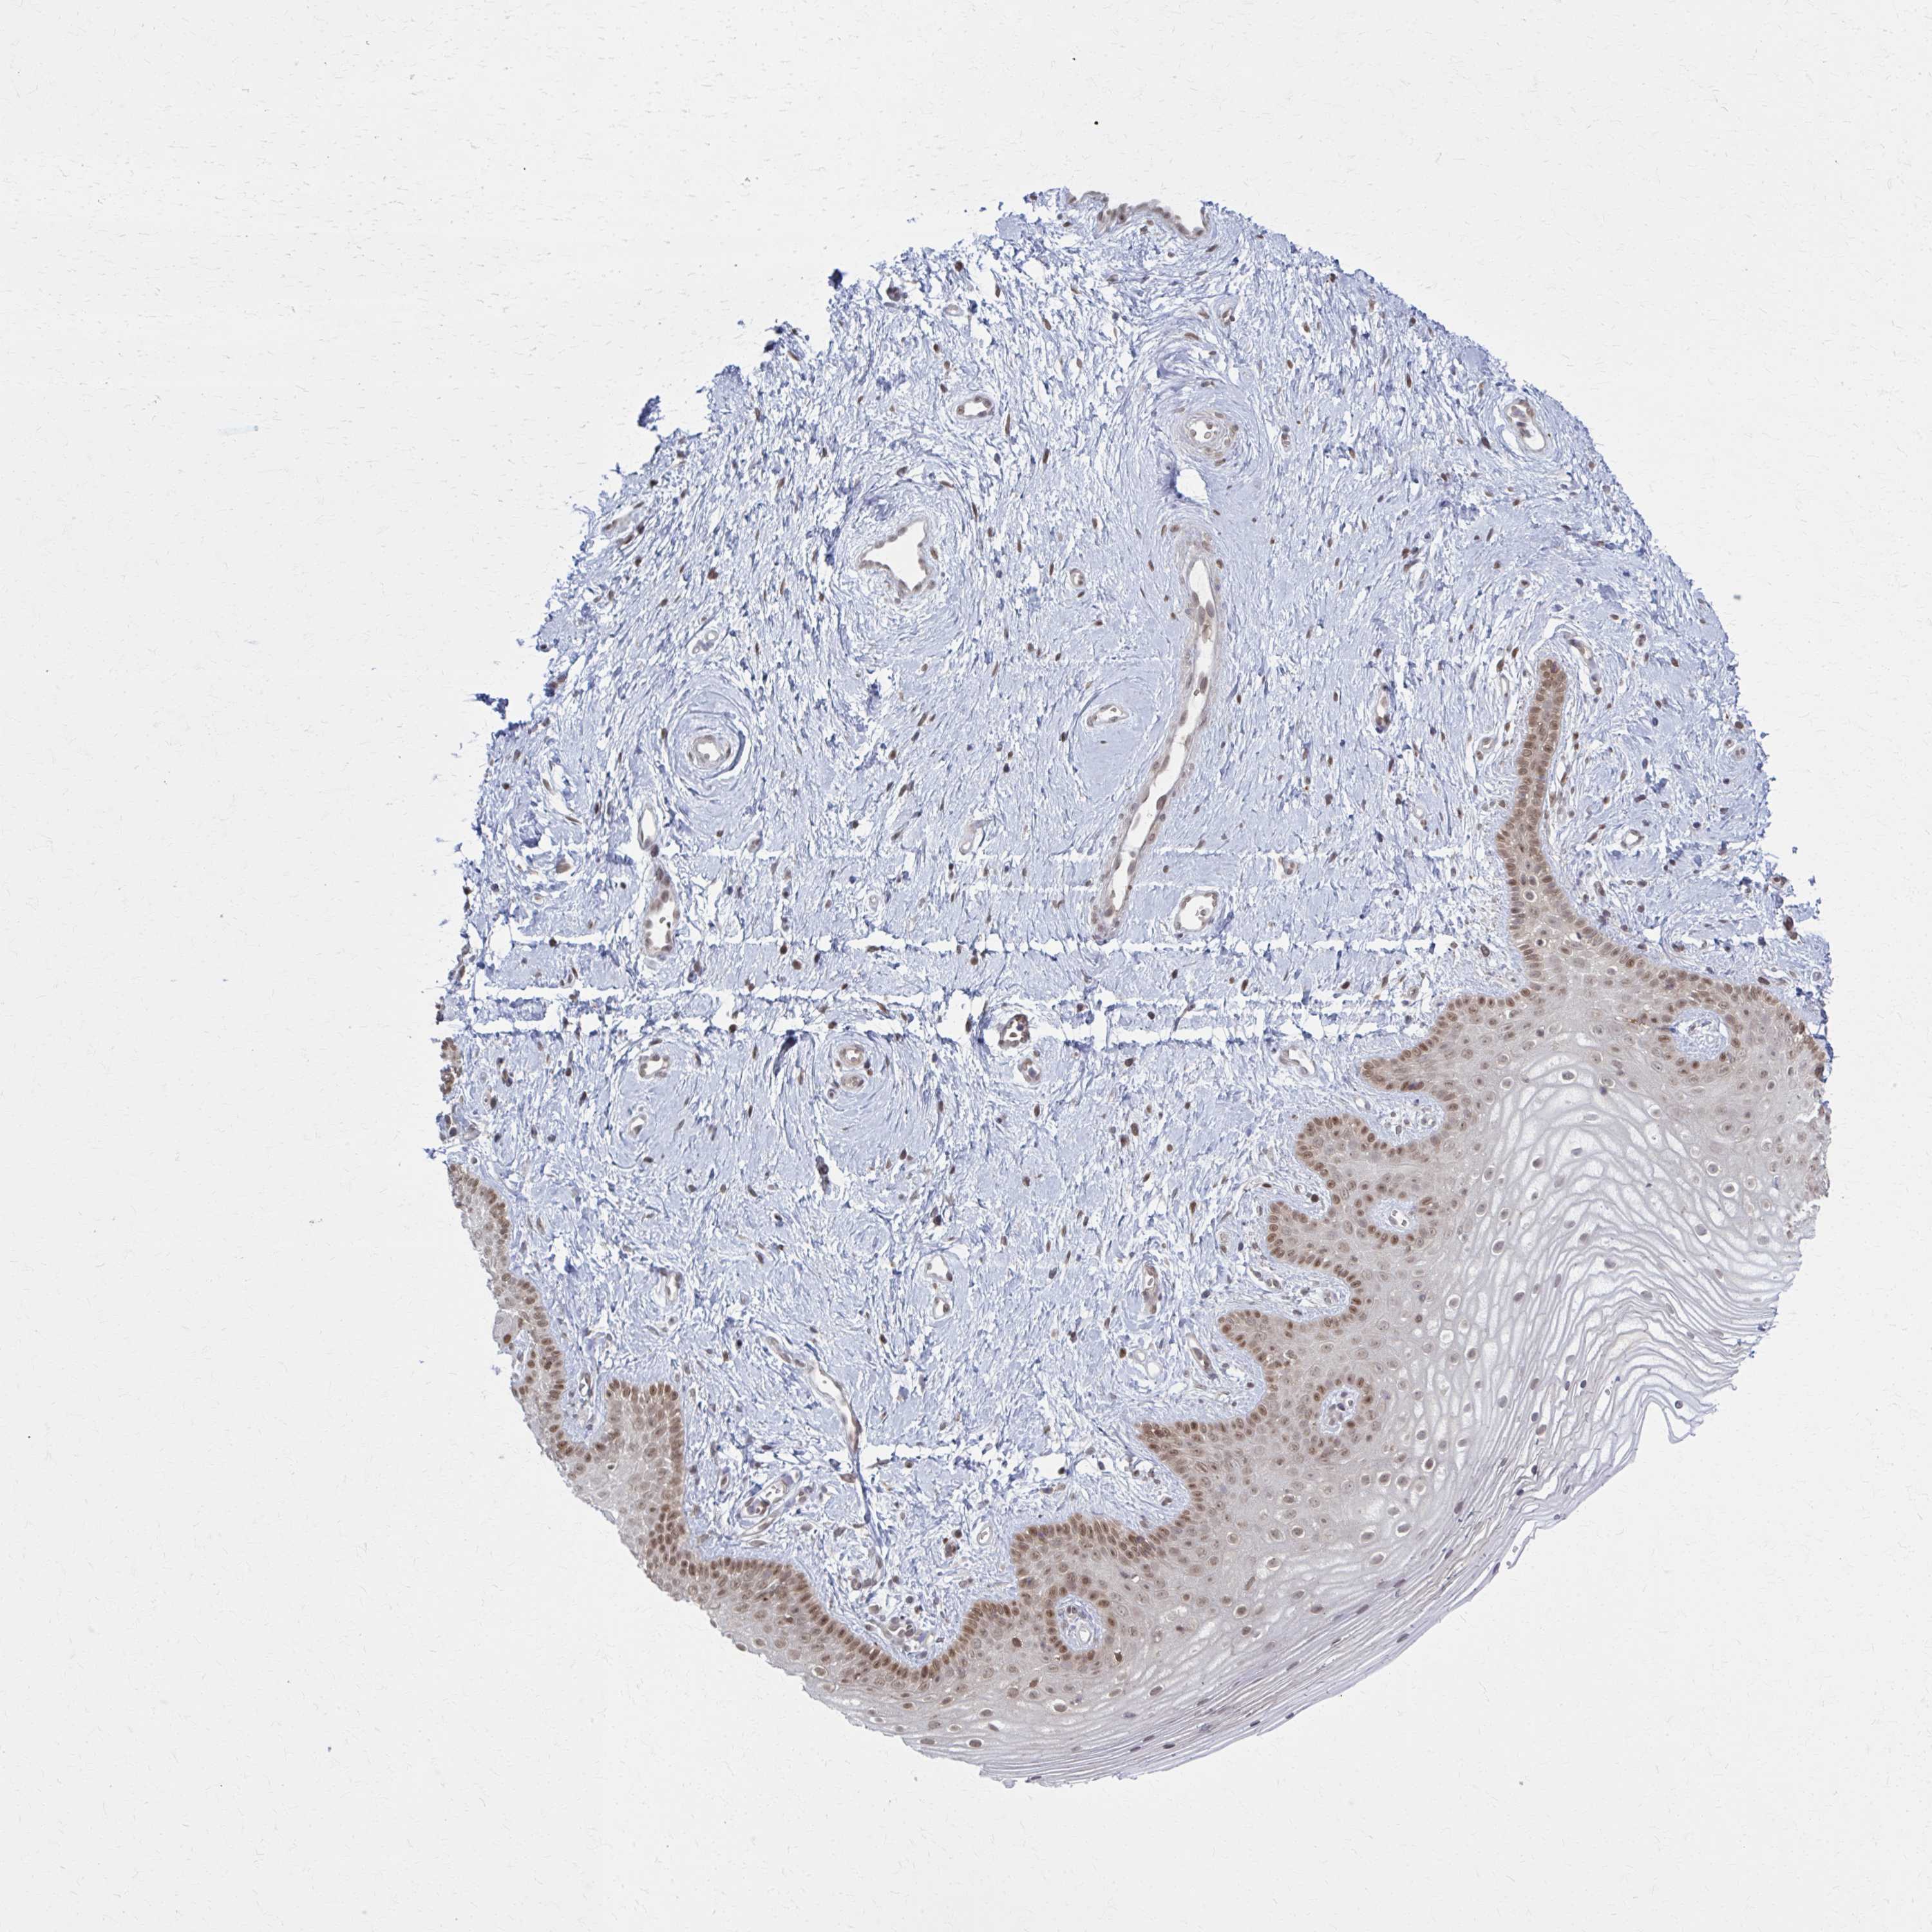
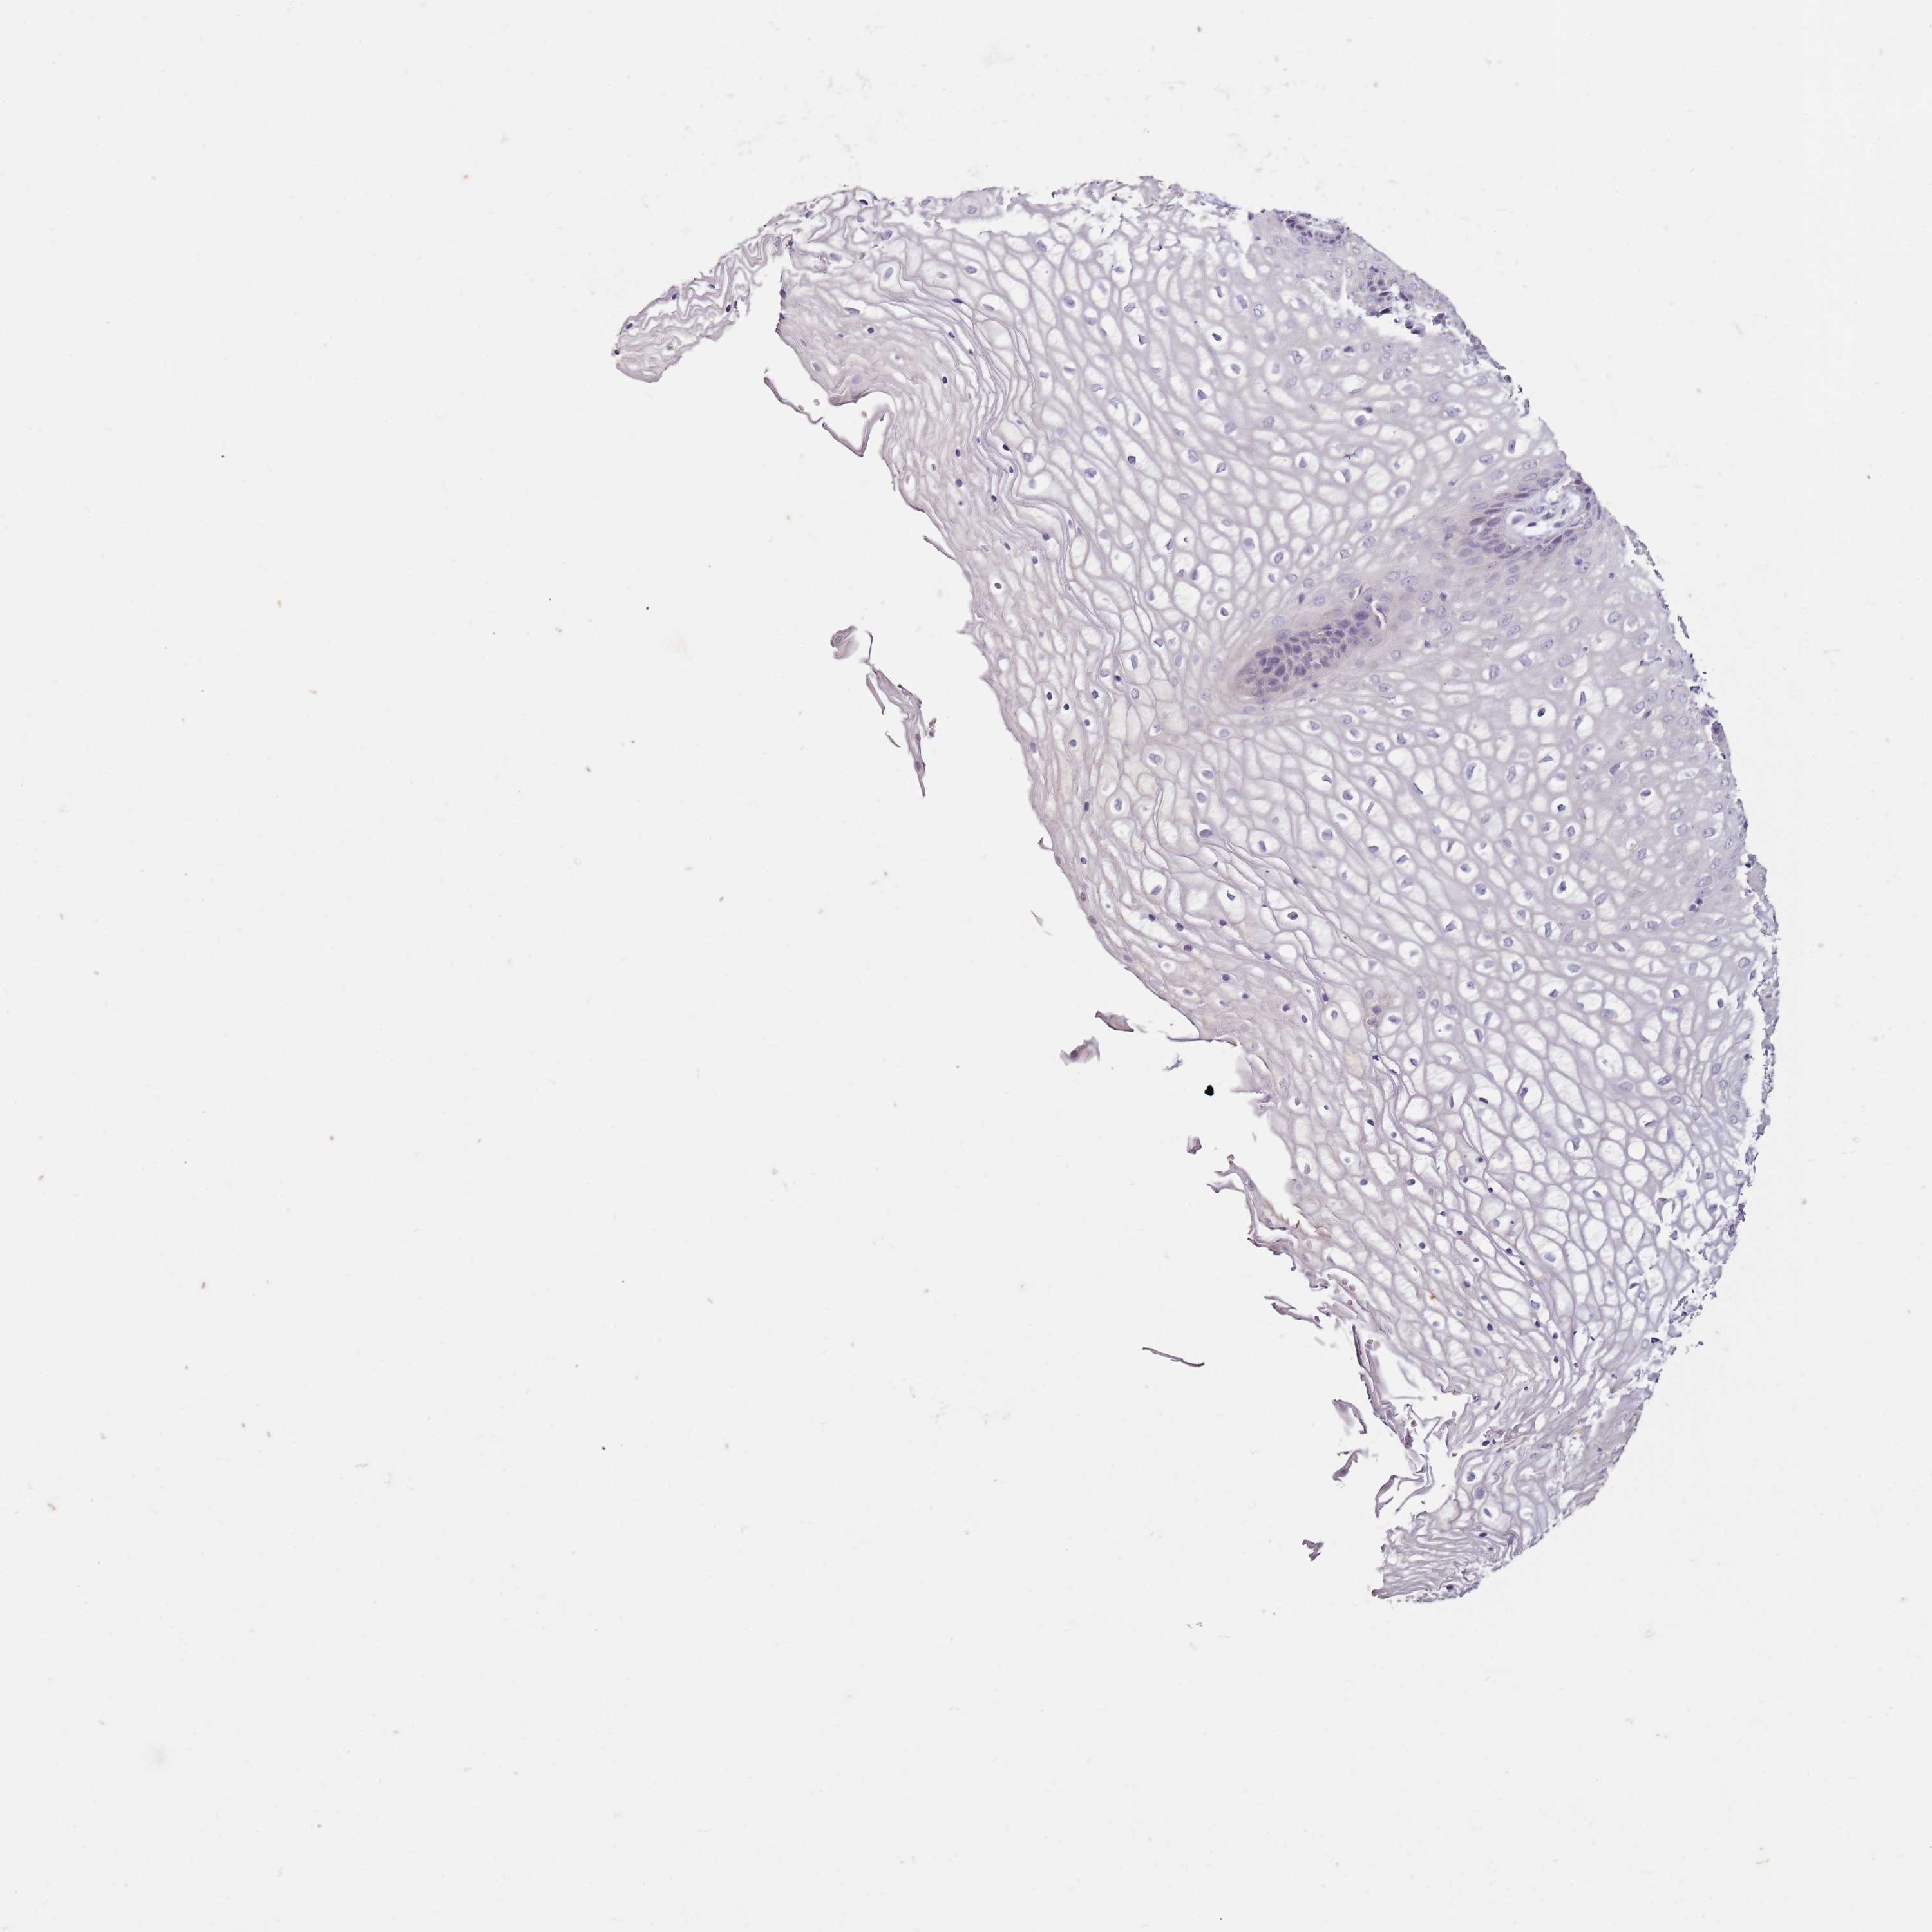
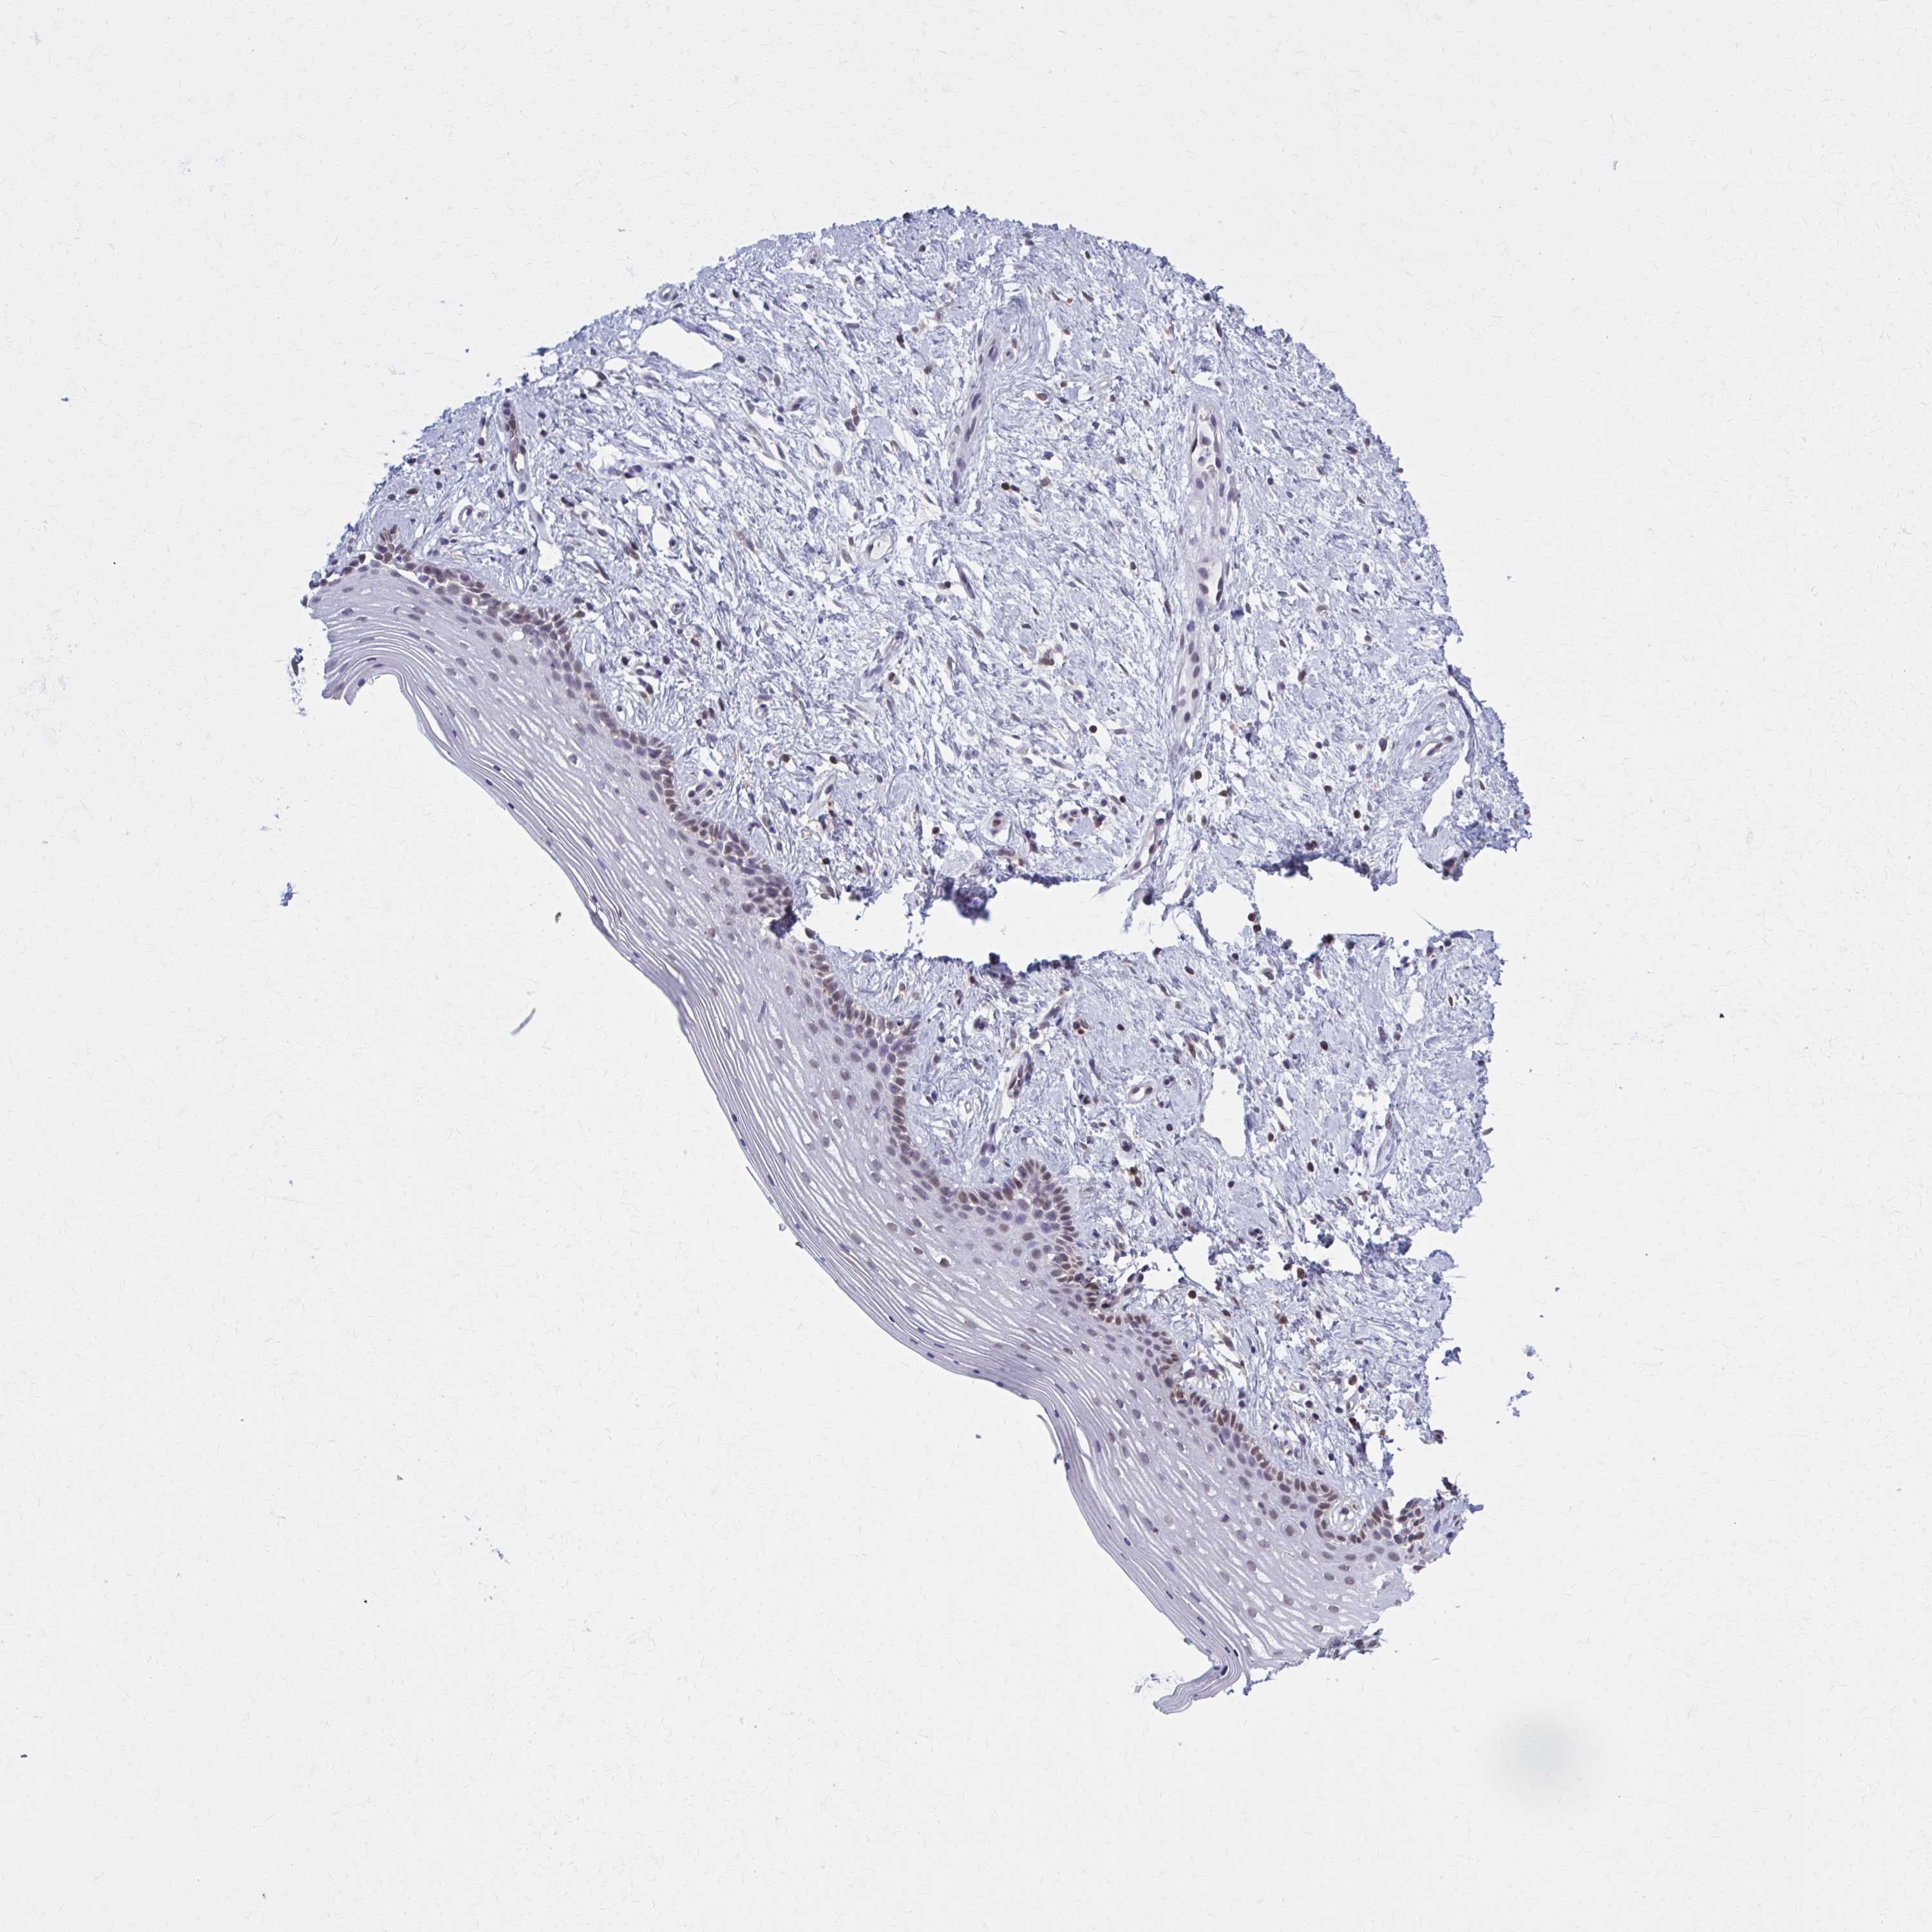
Antibody staining
Antibody HPA027296
Antibody HPA054276
Antibody CAB047333
Squamous epithelial cells
VAGINA - HPA RNA-seq
Pending HPA RNA-seq analysis
VAGINA - GTEx RNA-seq
Average RPKM
31.7
GTEx sample id
RPKM
Vagina
VAGINA - FANTOM5 CAGE
Average Tags Per Million
29.7
FANTOM5 sample id
Sample description
Tags Per Million