- THE HUMAN PROTEOME
- THE HUMAN TISSUES
- THE HUMAN CELL
- PROTEIN CLASSES
- PROTEIN EVIDENCE
- NEWS
- BLOG
- EVENTS
- PRESS ROOM
- LEARN
- DICTIONARY
- METHODS
- CELL LINES
|
TISSUE ATLAS
PRIMARY DATA
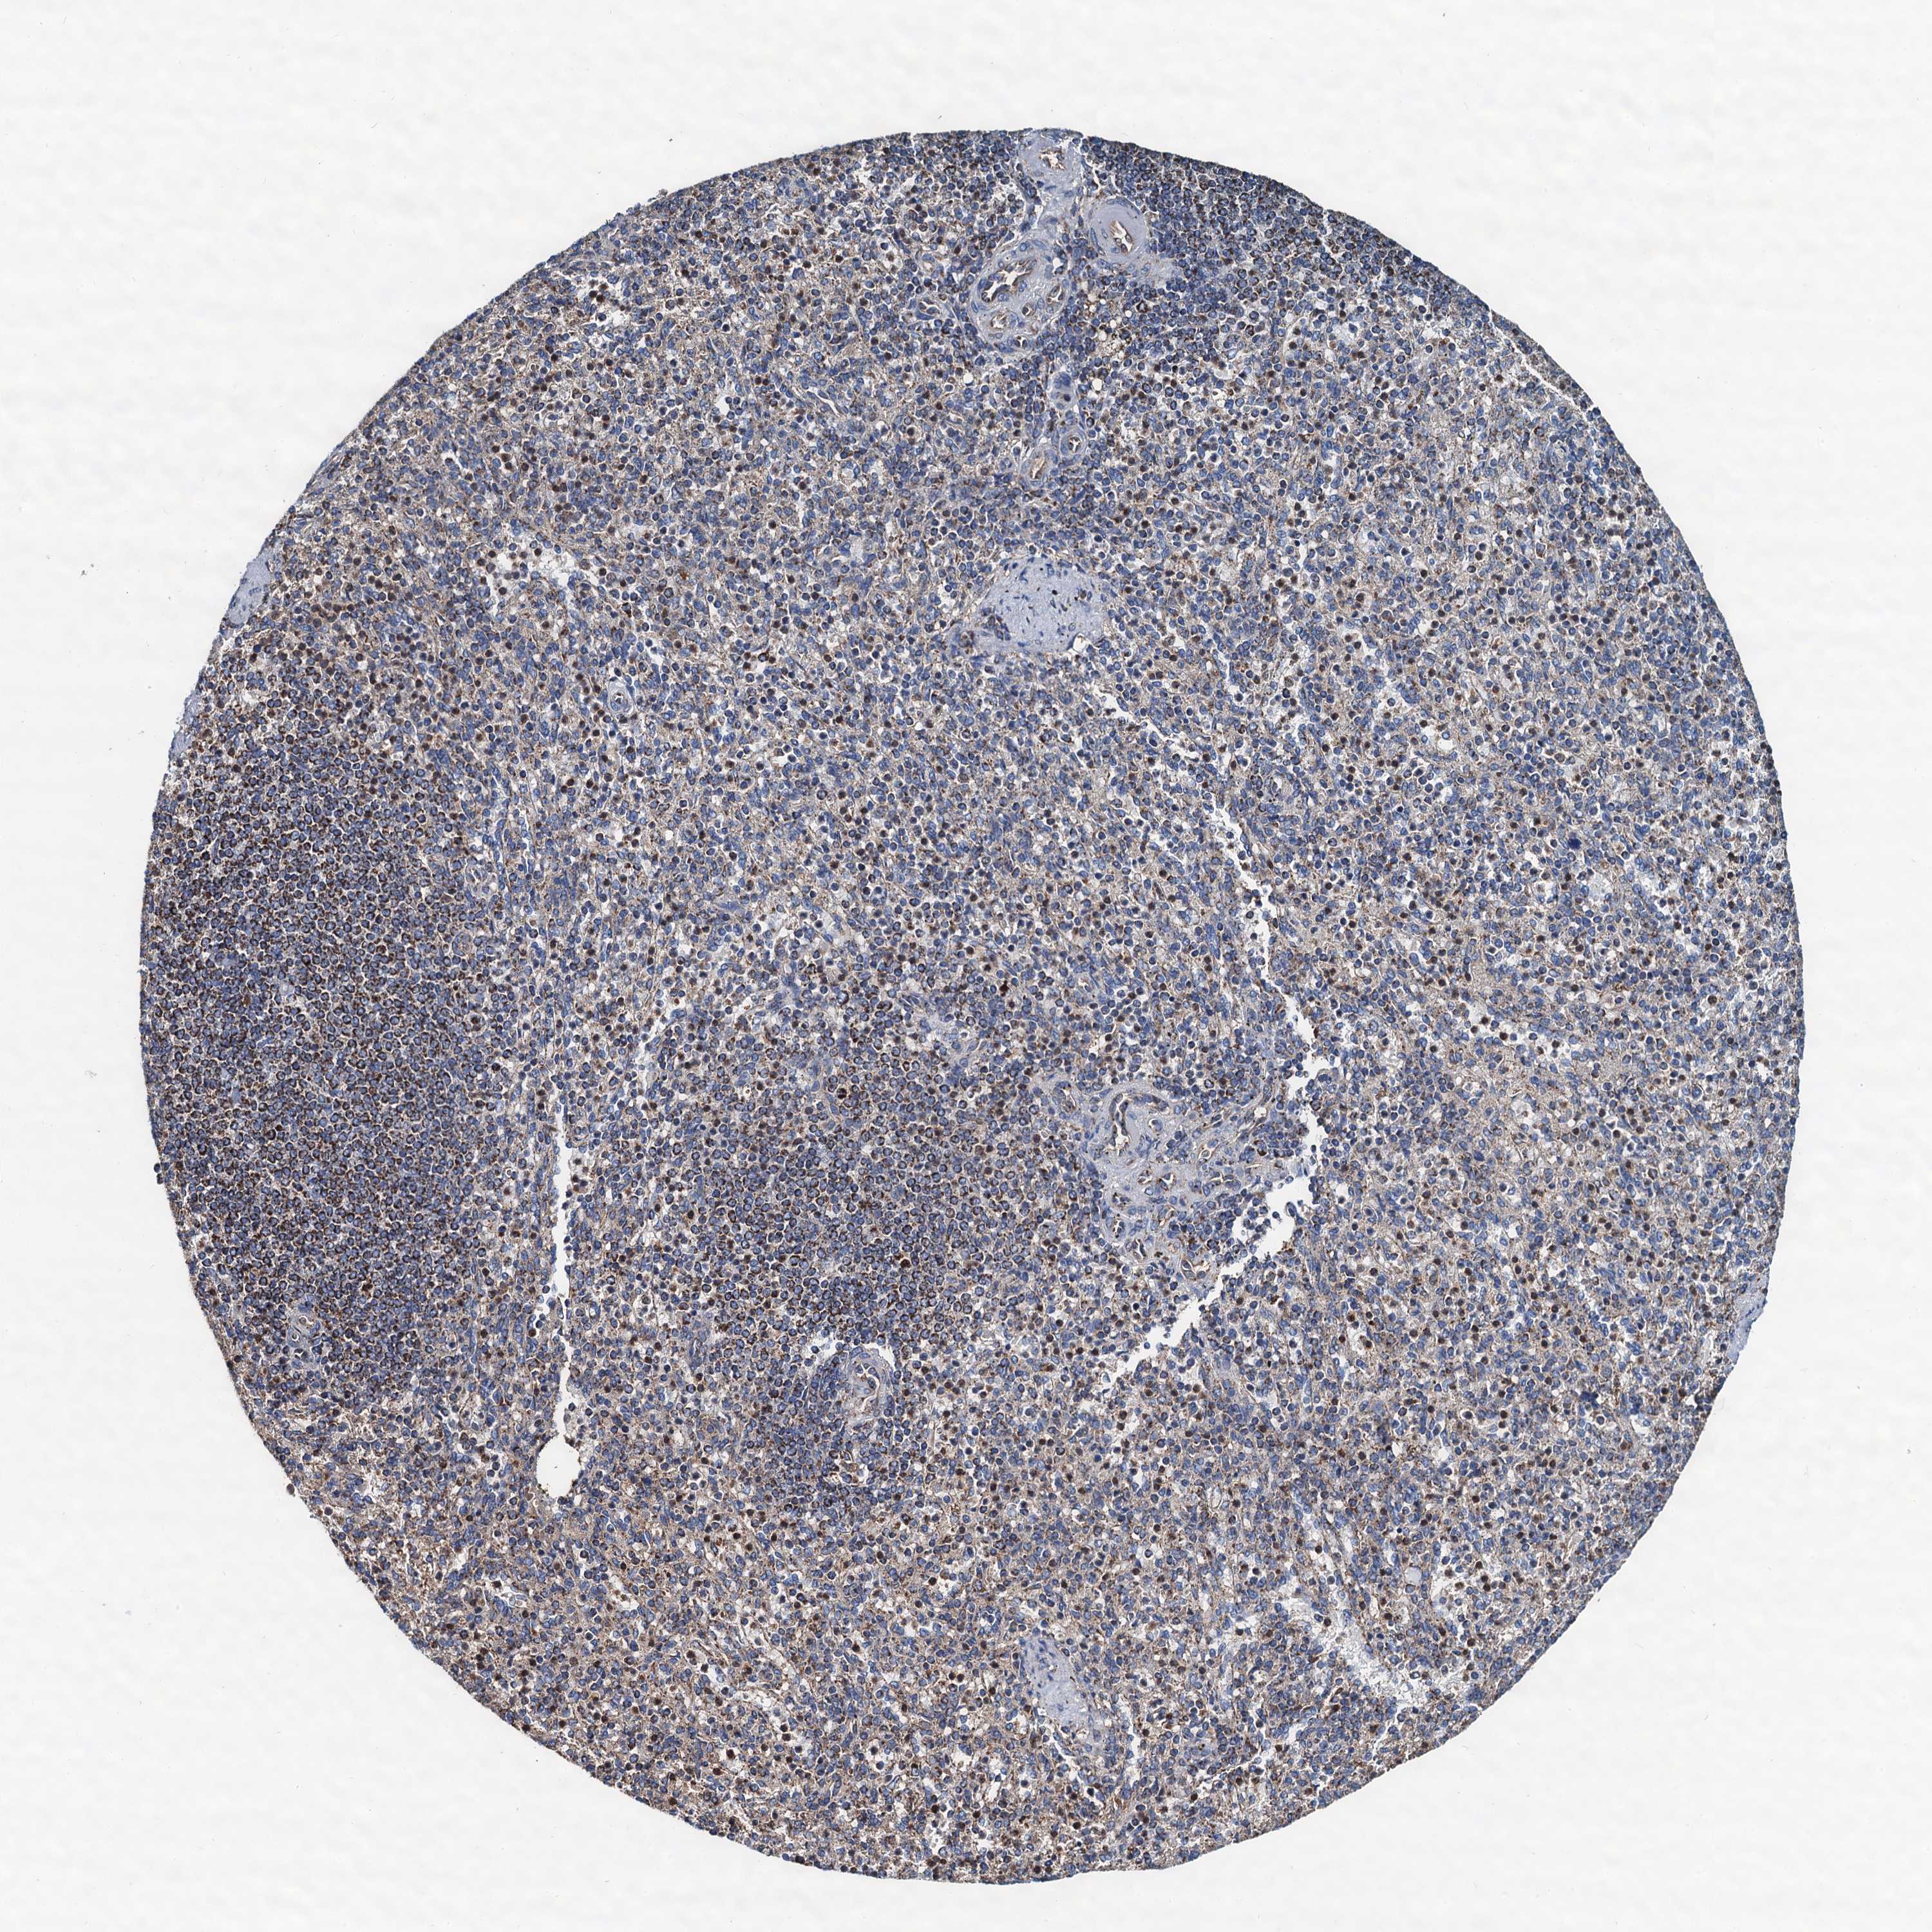
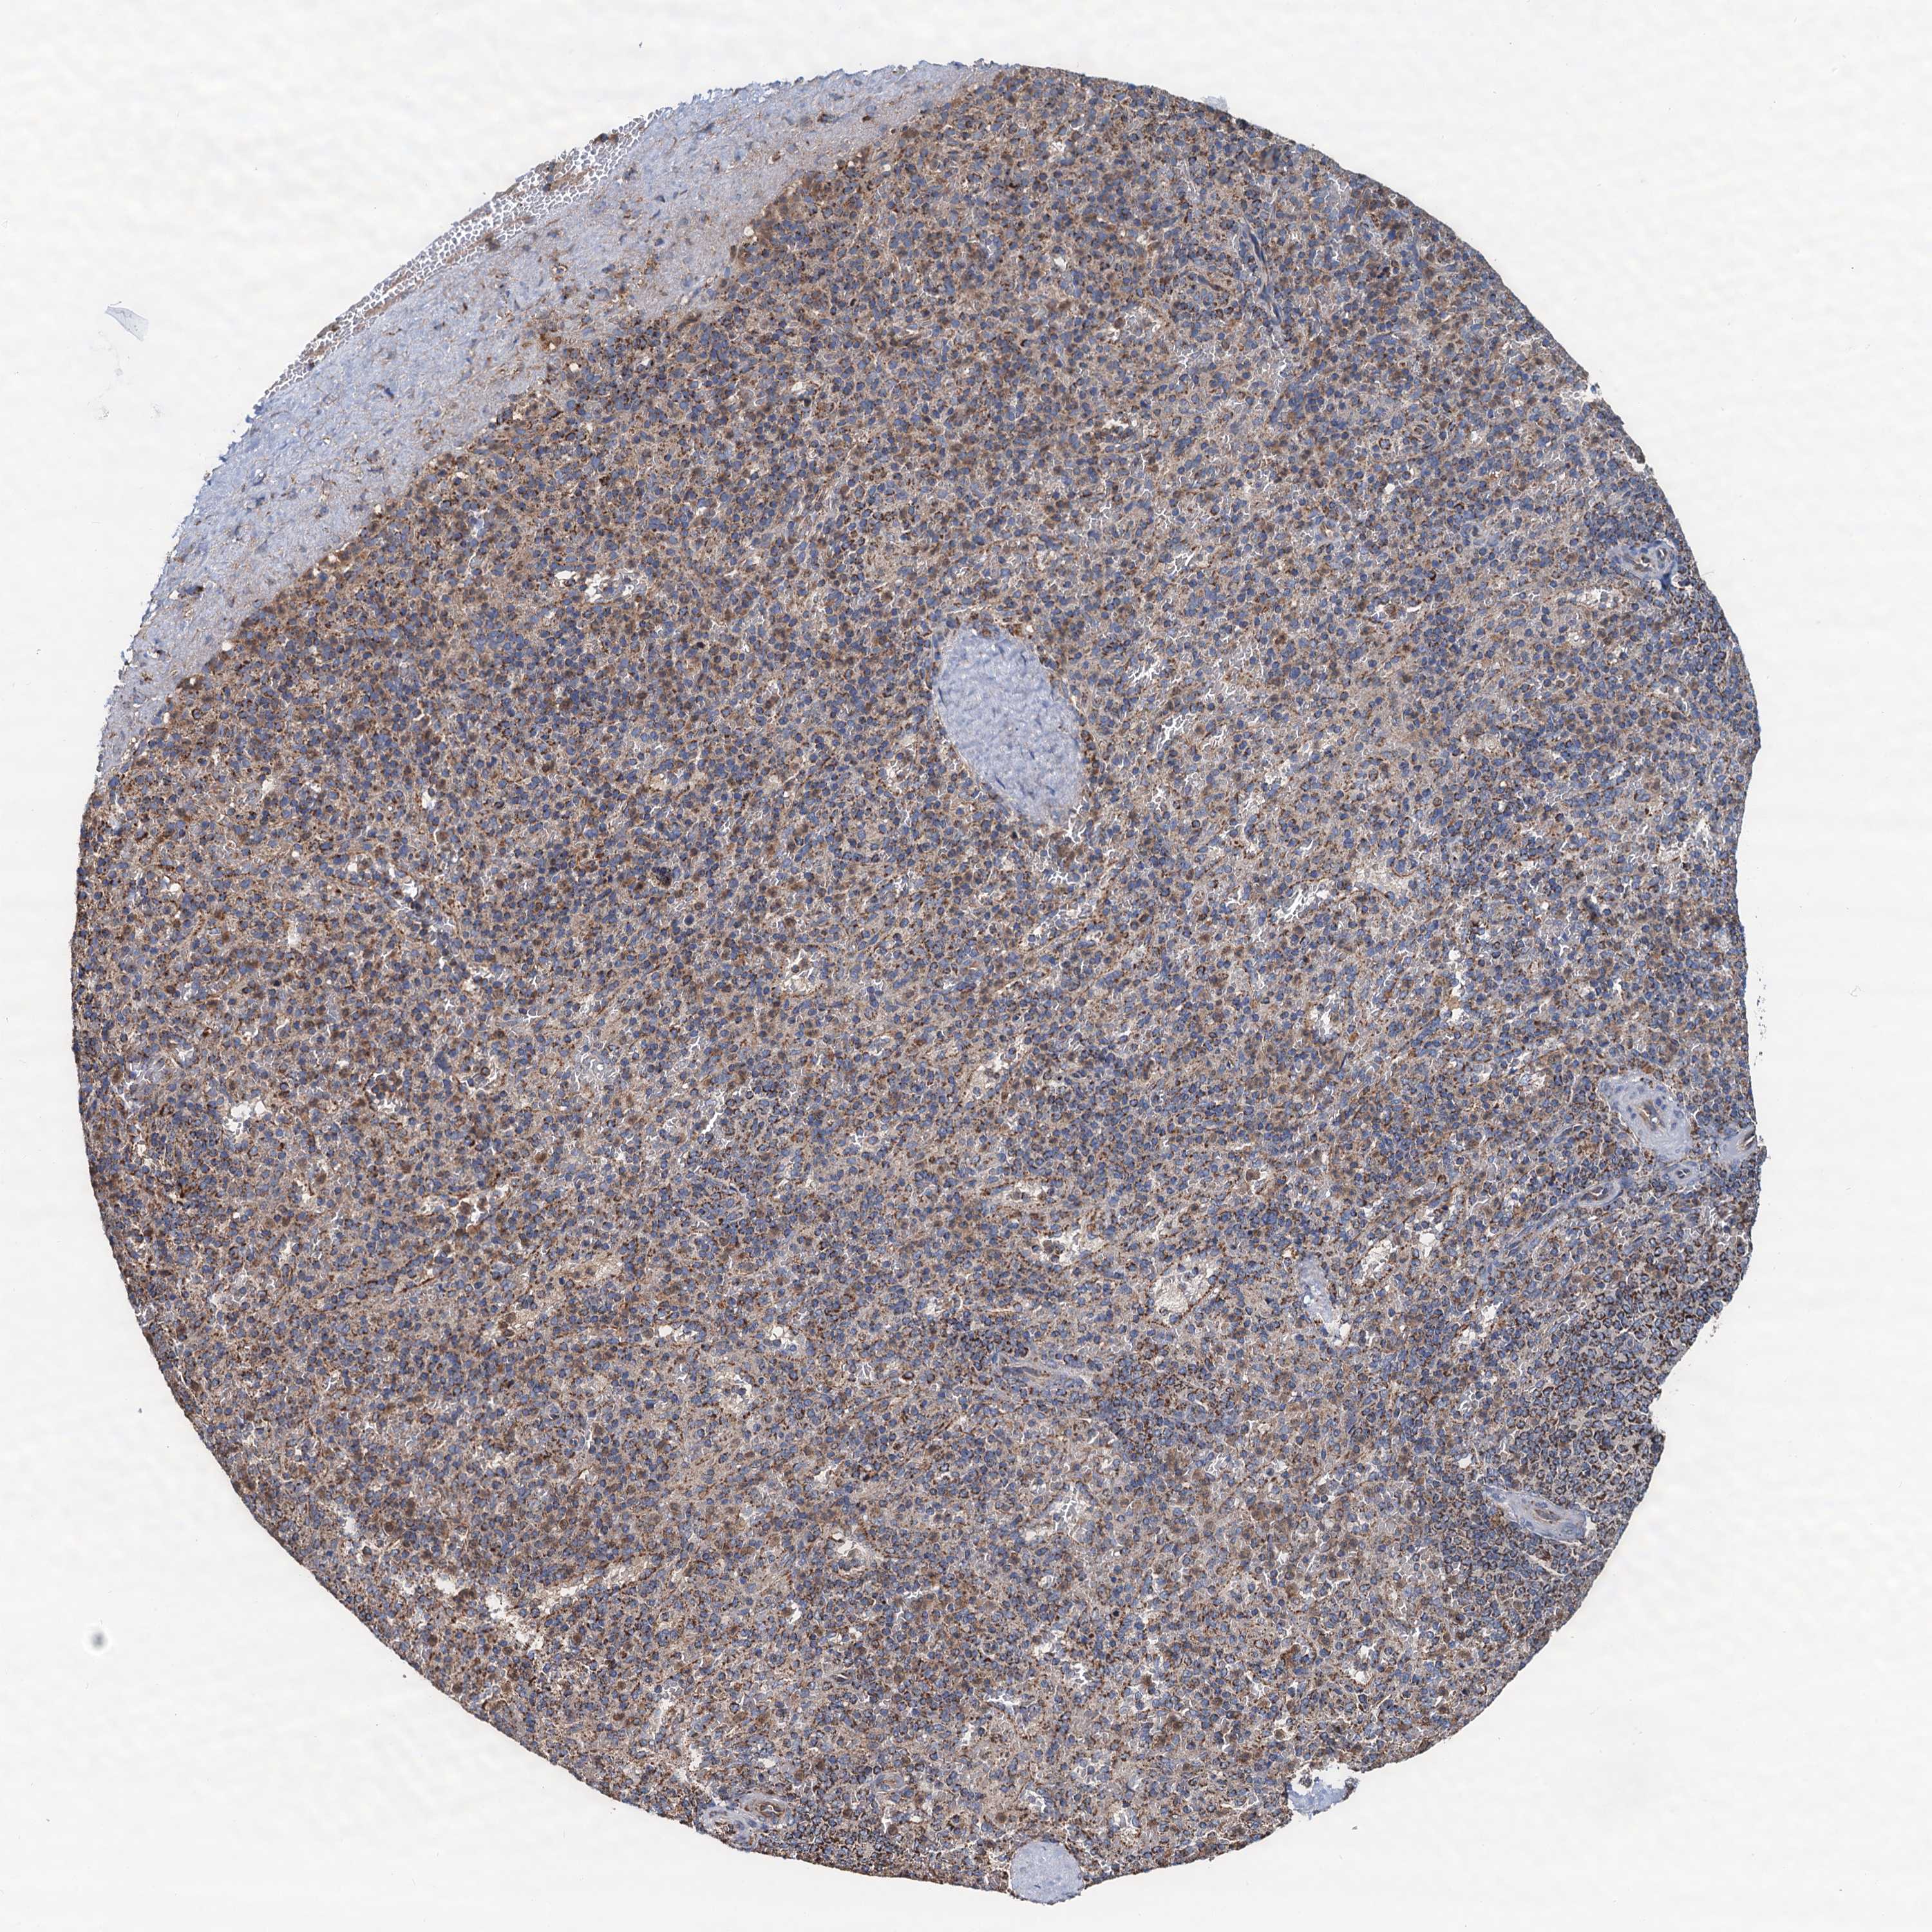
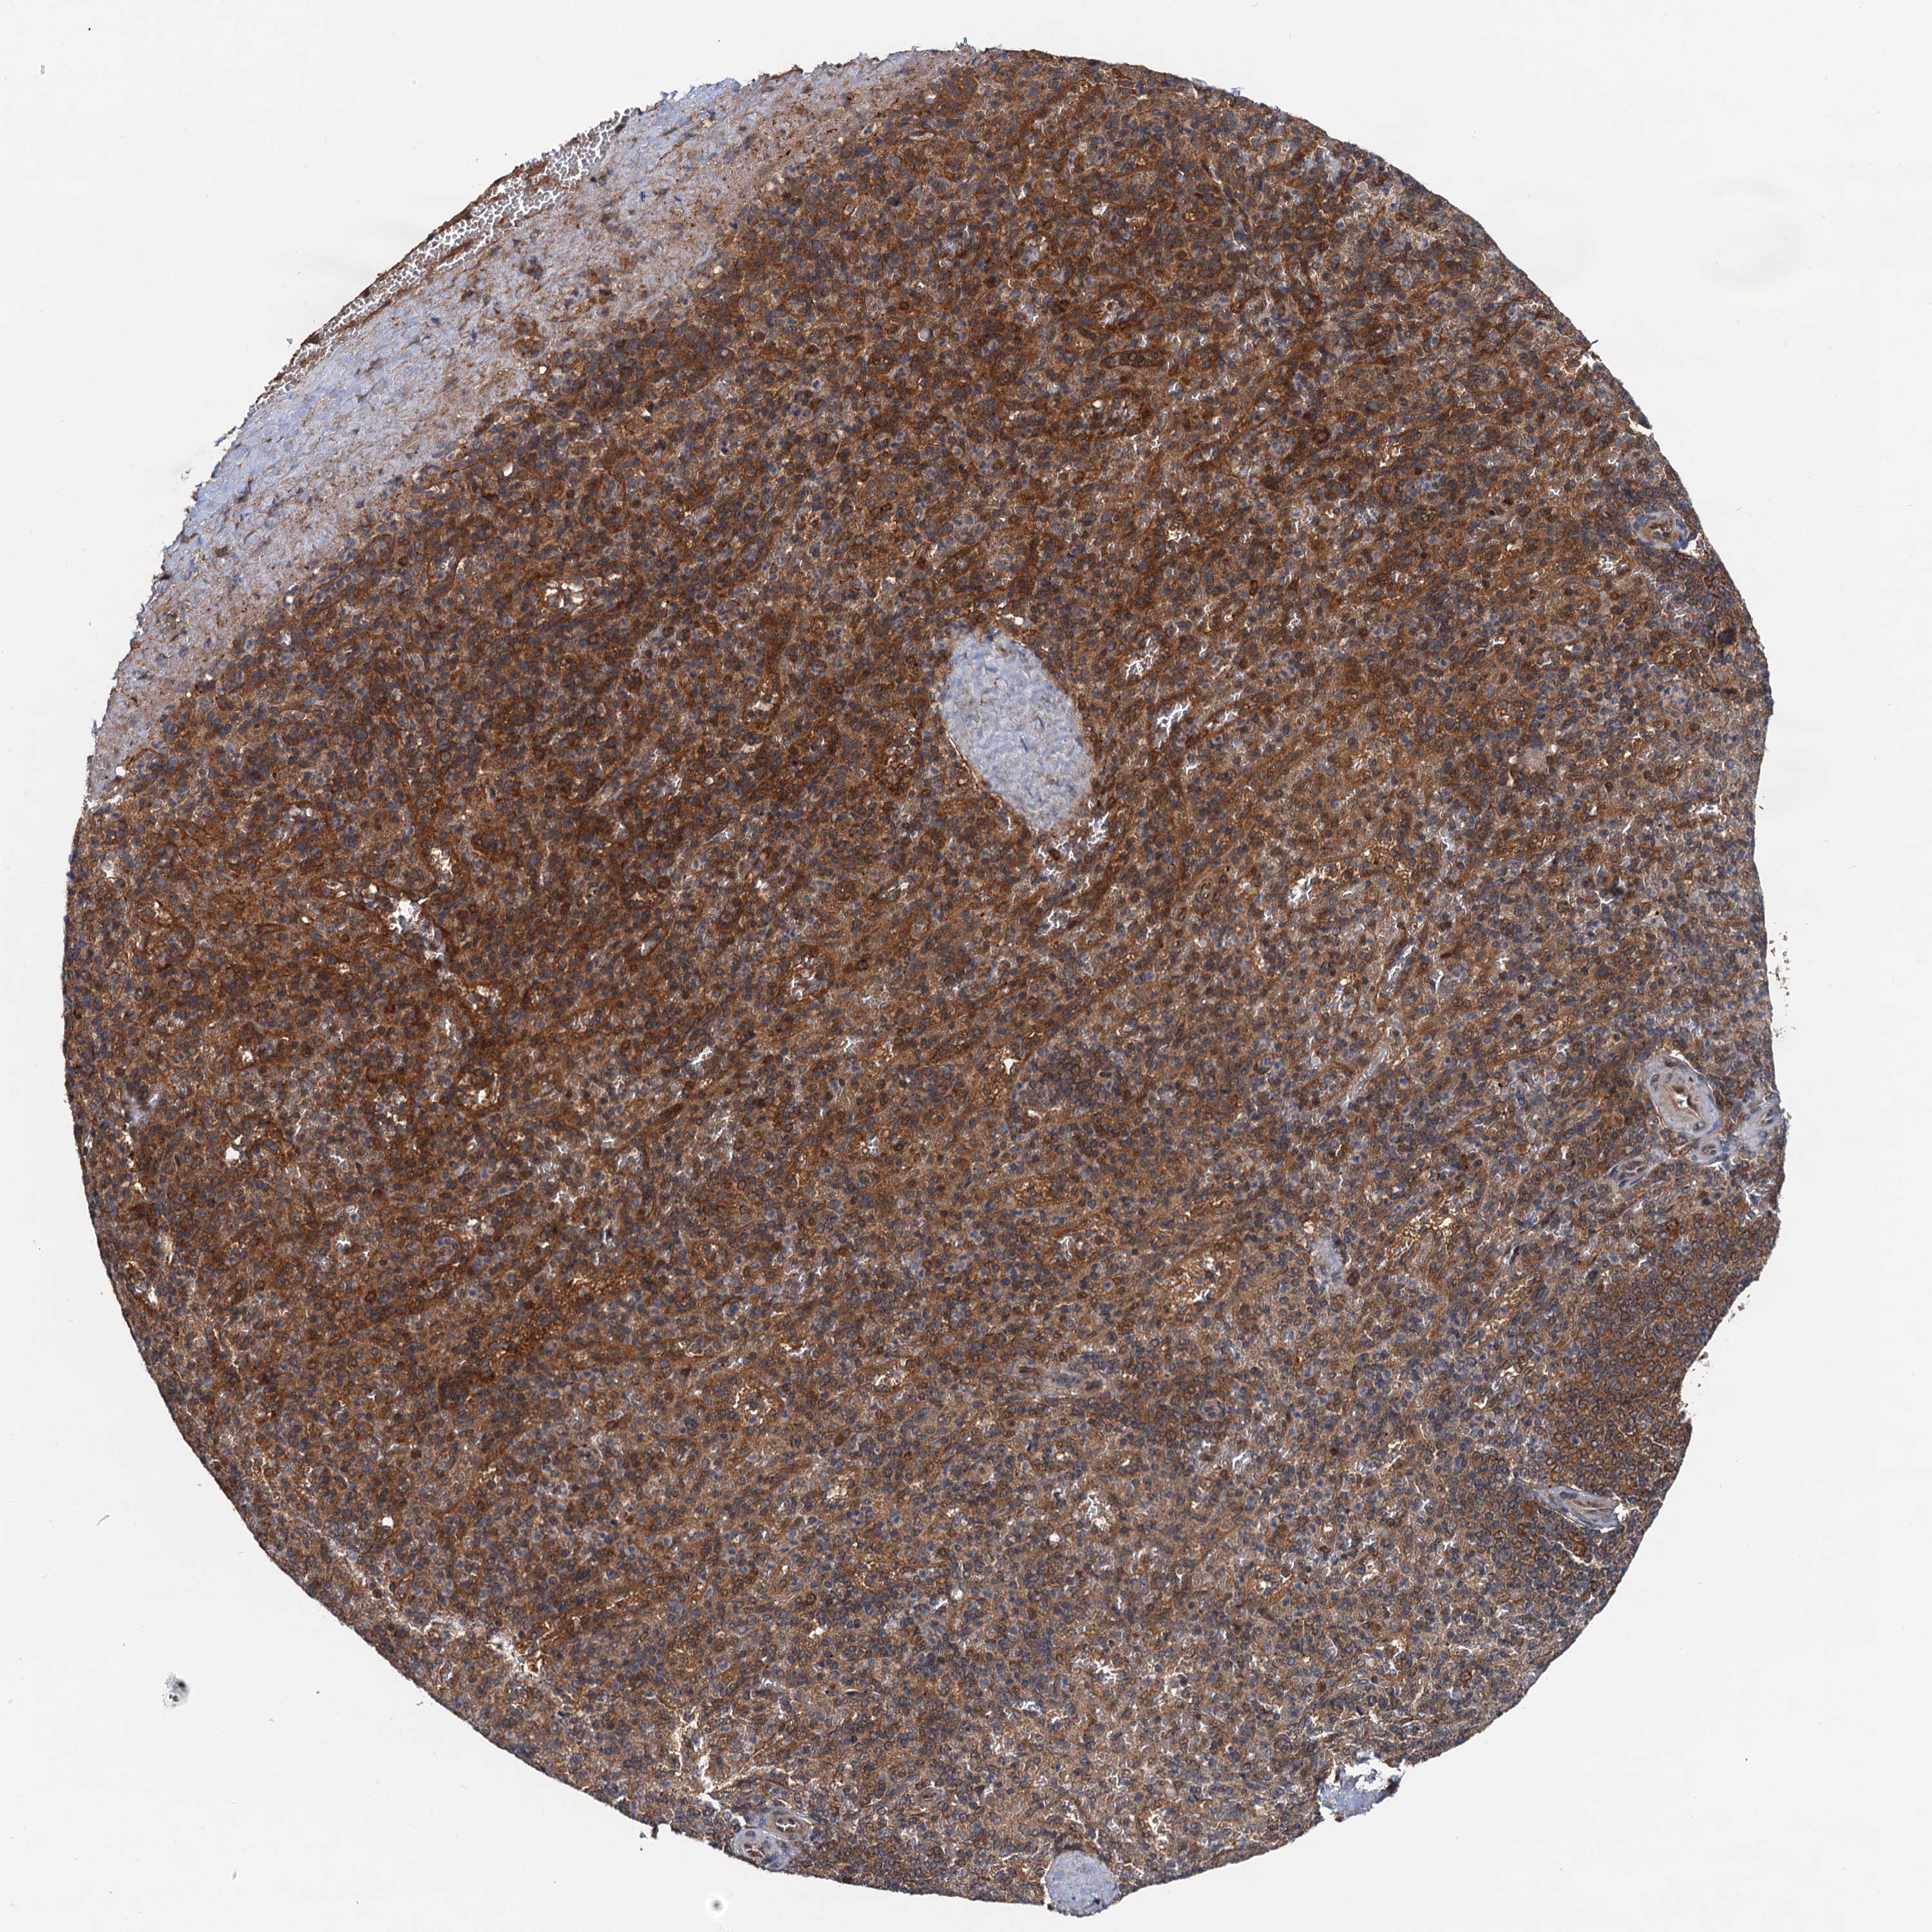
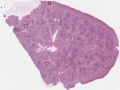
SPLEEN
GENE/PROTEIN
|
|
||||||||||||||||||||||||||||||||||||||||||||||||||||||||||||||||||||||||||||||||||||||||||||||||||||||||||||||||||||||||||||||||||||||||||||||||||||||||||||||||||||||||||||||||||||||||||||||
The Project
The Human Protein Atlas


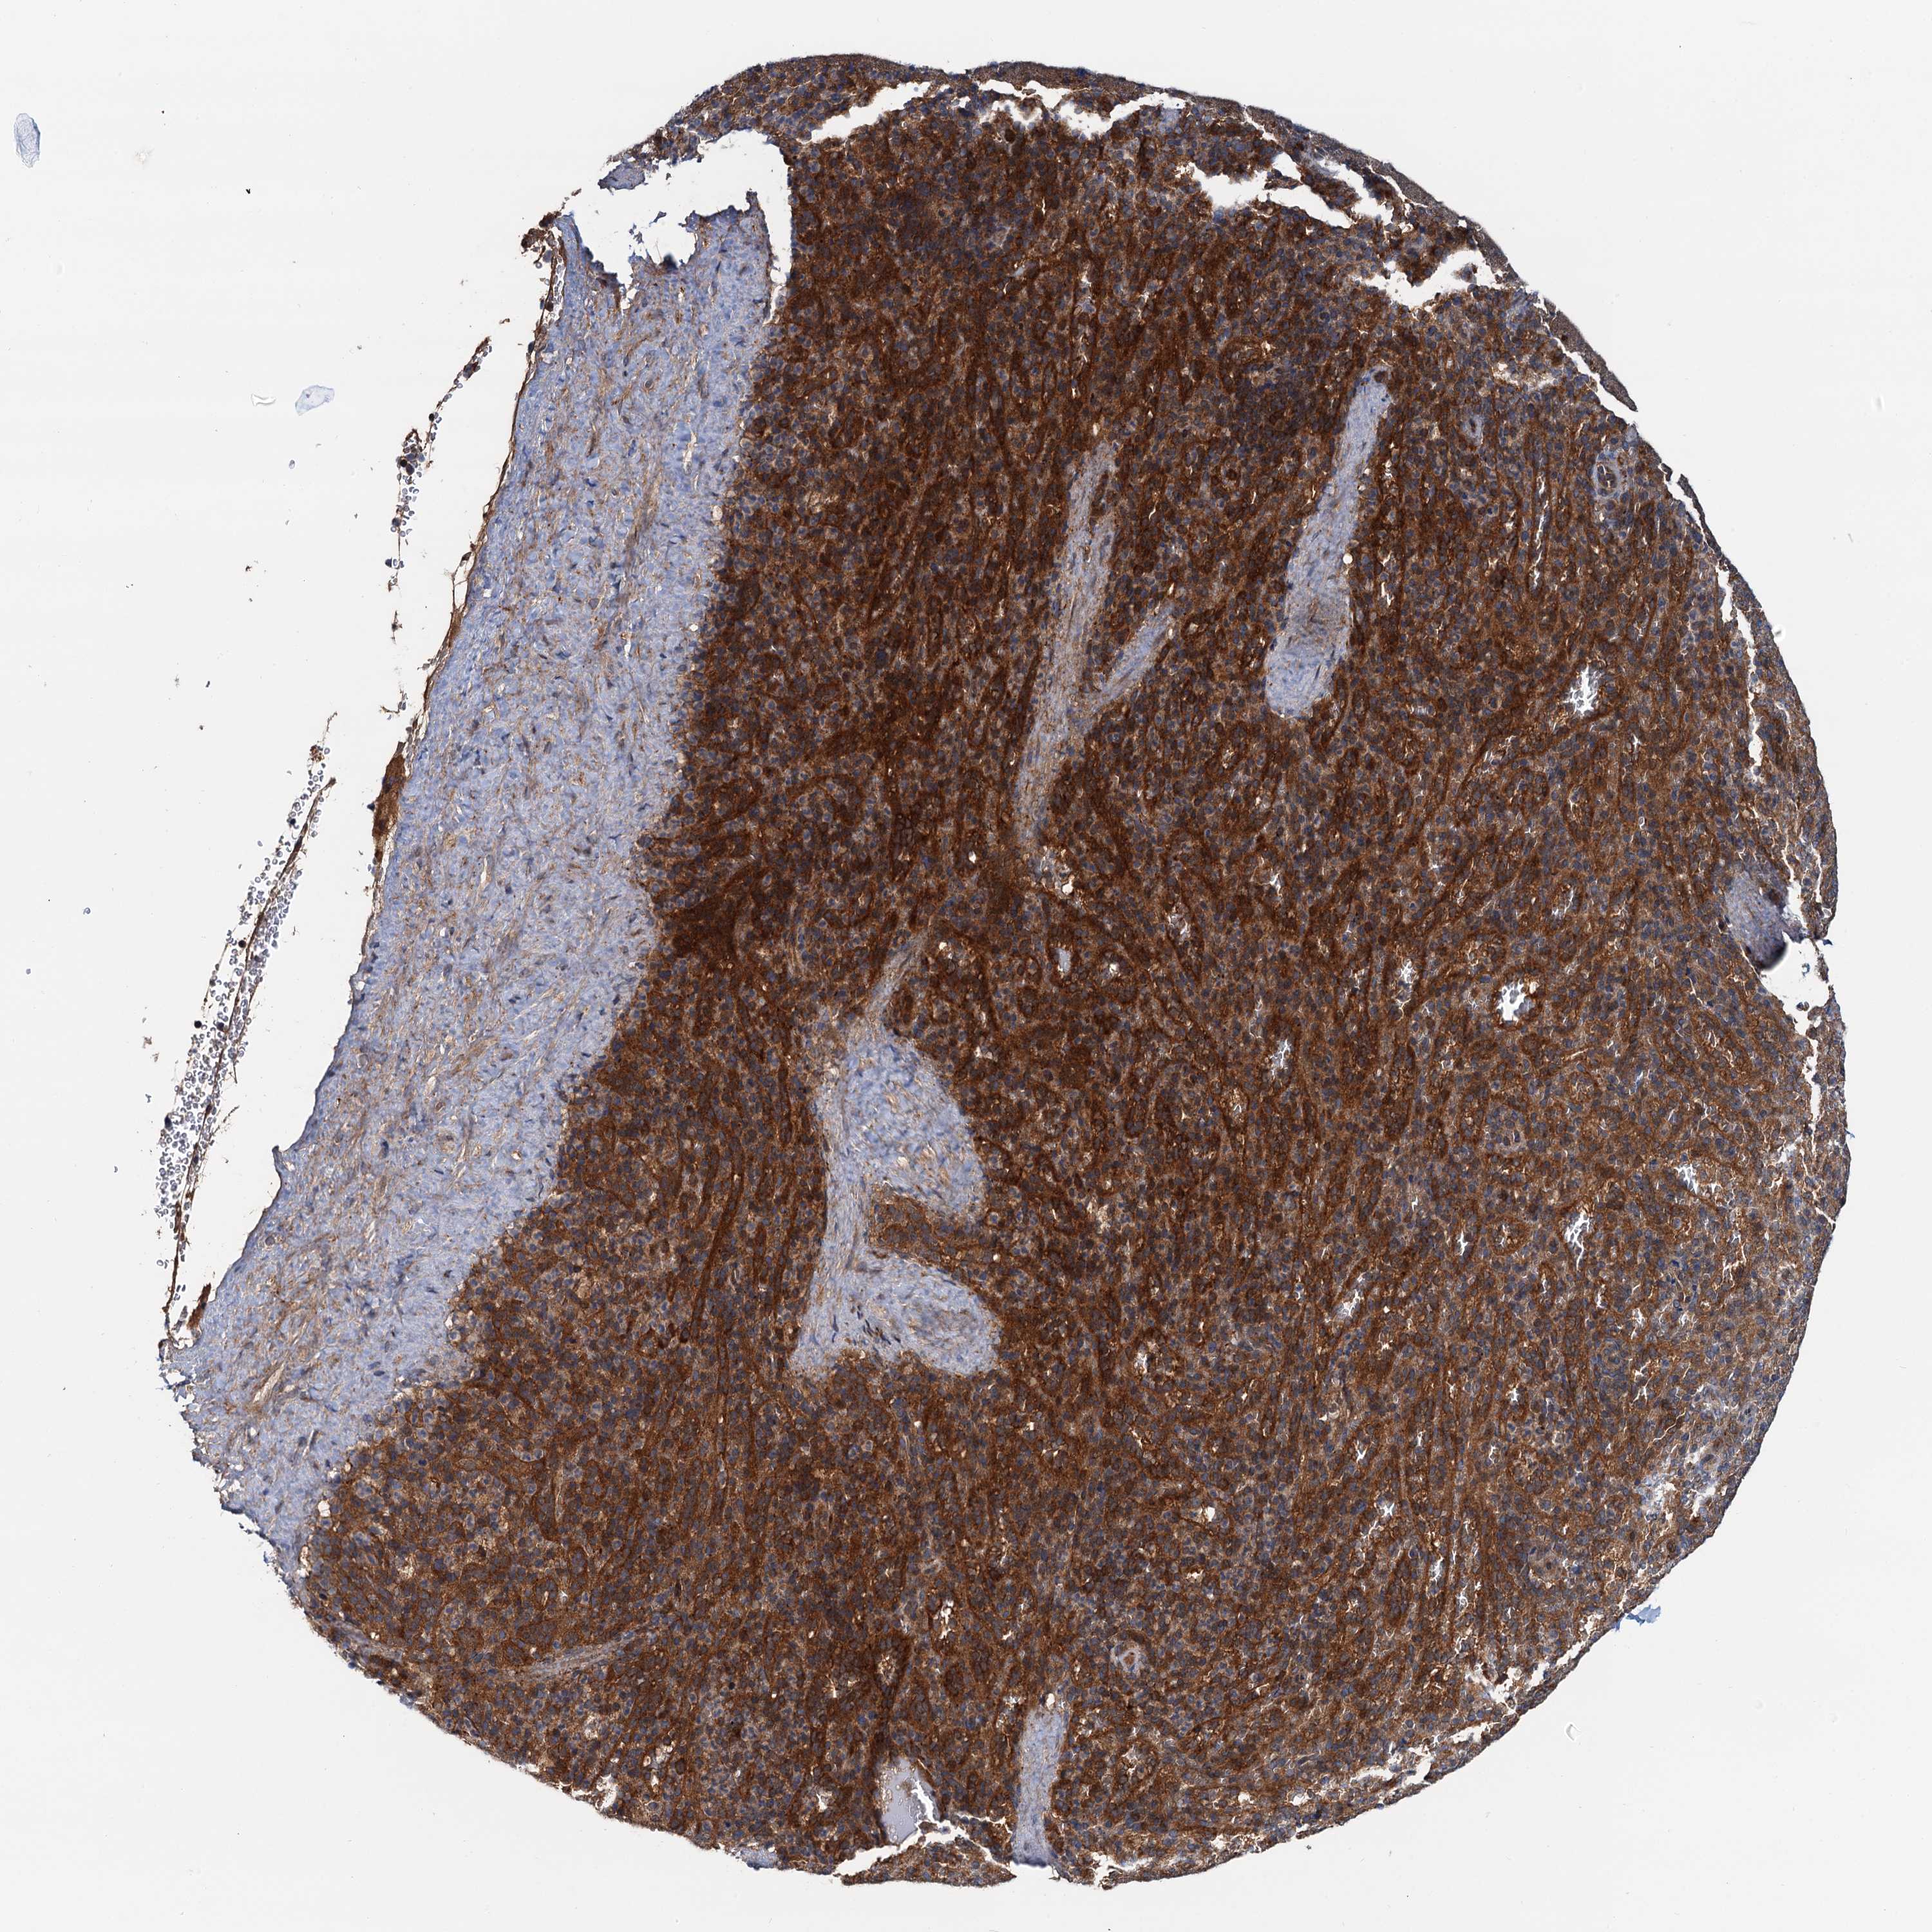


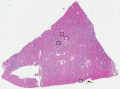 Female, age 60
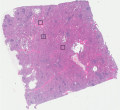 Male, age 17
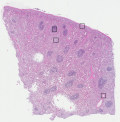 Male, age 20
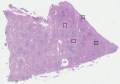 Female, age 19
 Female, age 65


