We use cookies to enhance the usability of our website. If you continue, we'll assume that you are happy to receive all cookies. More information. Don't show this again.
The cancer tissue page shows antibody staining in 20 different cancers. The assay and annotation is described here.
This page starts with information about the protein evidence and, when applicable, also protein class. Below the summary, a selection of four standard cancer tissue samples is displayed as representative of the overall staining pattern. From left: colorectal cancer, breast cancer, prostate cancer and lung cancer. An additional 5th image can be added as a complement.
CD markers, Disease related genes, Plasma proteins, Potential drug targets, Predicted membrane proteins, Transporters
Protein evidence
Evidence at protein level
Colorectal cancer
Breast cancer
Prostate cancer
Lung cancer
Liver cancer
STAINING SUMMARYi
The cancer tissue summary page shows antibody staining in 20 different cancers. The assay and annotation is described here.
For each cancer, the fraction of samples with antibody staining/protein expression level high, medium, low, or not detected are provided by the blue-scale color-coding (as described by the color-coding scale in the box to the right). The length of the bar represents the number of patient samples analyzed (max=12 patients). The images and annotations can be accessed by clicking on the cancer name or protein expression bar. If more than one antibody is analyzed, the tabs at the top of the staining summary section can be used to toggle between the different antibodies. The tooltip function displays additional data for the features in the staining summary view.
Next to the cancer staining data, the protein expression data of normal tissues or specific cell types corresponding to each cancer are shown and protein expression levels are indicated by the blue-scale color coding.
At the bottom of the page, a summary of the overall protein expression pattern across the analyzed cancer tissues as well as information about literature conformity are presented.
Cancer cells were generally weakly stained or negative. Moderate to strong membranous and cytoplasmic immunoreactivity was observed in a few cases of melanoma, ovarian and testicular cancers.
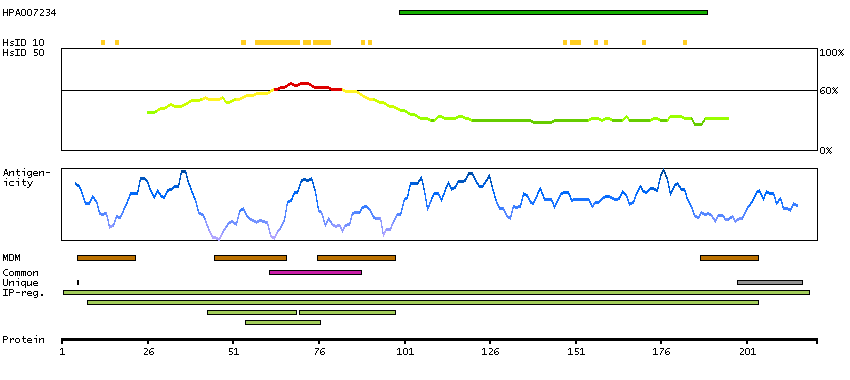
GENE INFORMATIONi
Gene information from Ensembl and Entrez, as well as links to available gene identifiers are displayed here. Information was retrieved from Ensembl if not indicated otherwise.
Gene name
CD81 (HGNC Symbol)
Synonyms
TAPA-1, TAPA1, TSPAN28
Description
CD81 molecule (HGNC Symbol)
Entrez gene summary
The protein encoded by this gene is a member of the transmembrane 4 superfamily, also known as the tetraspanin family. Most of these members are cell-surface proteins that are characterized by the presence of four hydrophobic domains. The proteins mediate signal transduction events that play a role in the regulation of cell development, activation, growth and motility. This encoded protein is a cell surface glycoprotein that is known to complex with integrins. This protein appears to promote muscle cell fusion and support myotube maintenance. Also it may be involved in signal transduction. This gene is localized in the tumor-suppressor gene region and thus it is a candidate gene for malignancies. Two transcript variants encoding different isoforms have been found for this gene. [provided by RefSeq, Jul 2014]
The protein browser displays the antigen location on the target protein(s) and the features of the target protein. The tabs at the top of the protein view section can be used to switch between the different splice variants to which an antigen has been mapped.
At the top of the view, the position of the antigen (identified by the corresponding HPA identifier) is shown as a green bar. A yellow triangle on the bar indicates a <100% sequence identity to the protein target.
Under the antigens, the maximum percent sequence identity of the protein to all other proteins from other human genes is displayed, using a sliding window of 10 aa residues (HsID 10) or 50 aa residues (HsID 50) (read more).
If a signal peptide is predicted by a majority of the signal peptide predictors SPOCTOPUS, SignalP 4.0, and Phobius (turquoise) and/or transmembrane regions (orange) are predicted by MDM, these are displayed.
Low complexity regions are shown in yellow and InterPro regions in green. Common (purple) and unique (grey) regions between different splice variants of the gene are also displayed (read more), and at the bottom of the protein view is the protein scale.
The protein information section displays alternative protein-coding transcripts (splice variants) encoded by this gene according to the Ensembl database.
The ENSP identifier links to the Ensembl website protein summary, while the ENST identifier links to the Ensembl website transcript summary for the selected splice variant. The data in the UniProt column can be expanded to show links to all matching UniProt identifiers for this protein.
The protein classes assigned to this protein are shown if expanding the data in the protein class column. Parent protein classes are in bold font and subclasses are listed under the parent class.
The Gene Ontology terms assigned to this protein are listed if expanding the Gene ontology column. The length of the protein (amino acid residues according to Ensembl), molecular mass (kDalton), predicted signal peptide (according to a majority of the signal peptide predictors SPOCTOPUS, SignalP 4.0, and Phobius) and the number of predicted transmembrane region(s) (according to MDM) are also reported.