TISSUE
CELL
CANCER
Antibody validation
Dictionary
CAUDATE - Expression summary
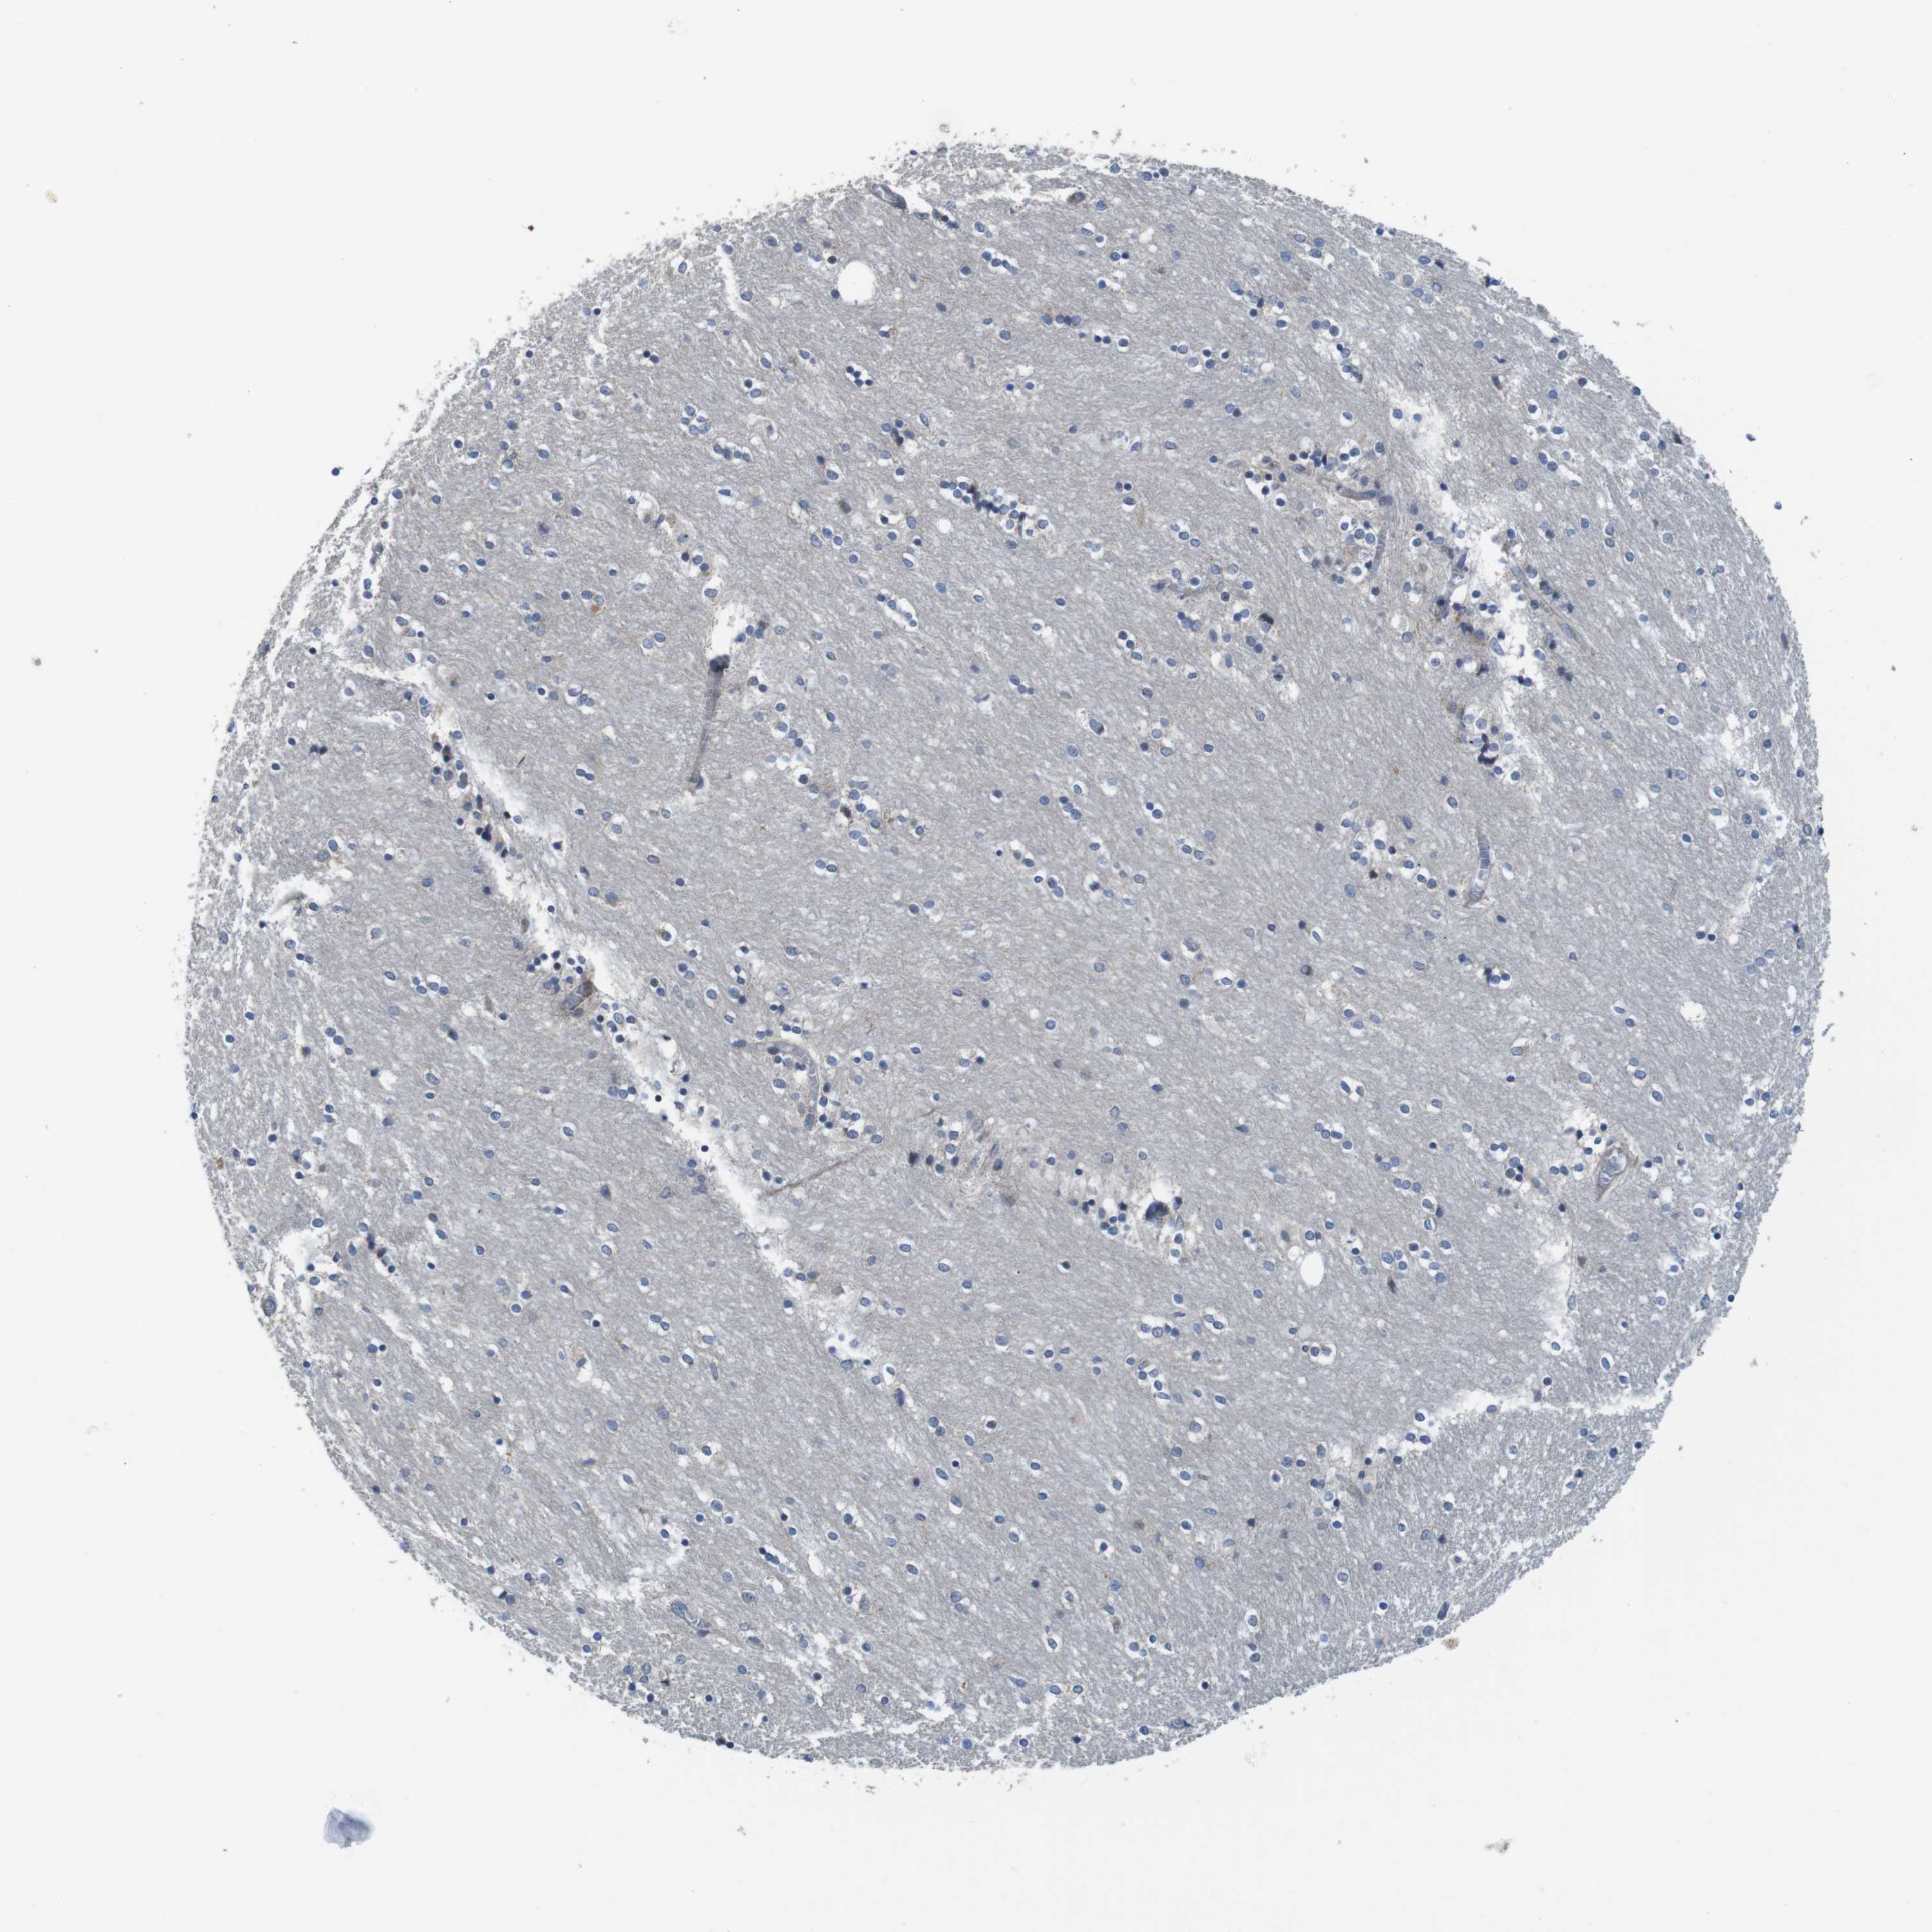
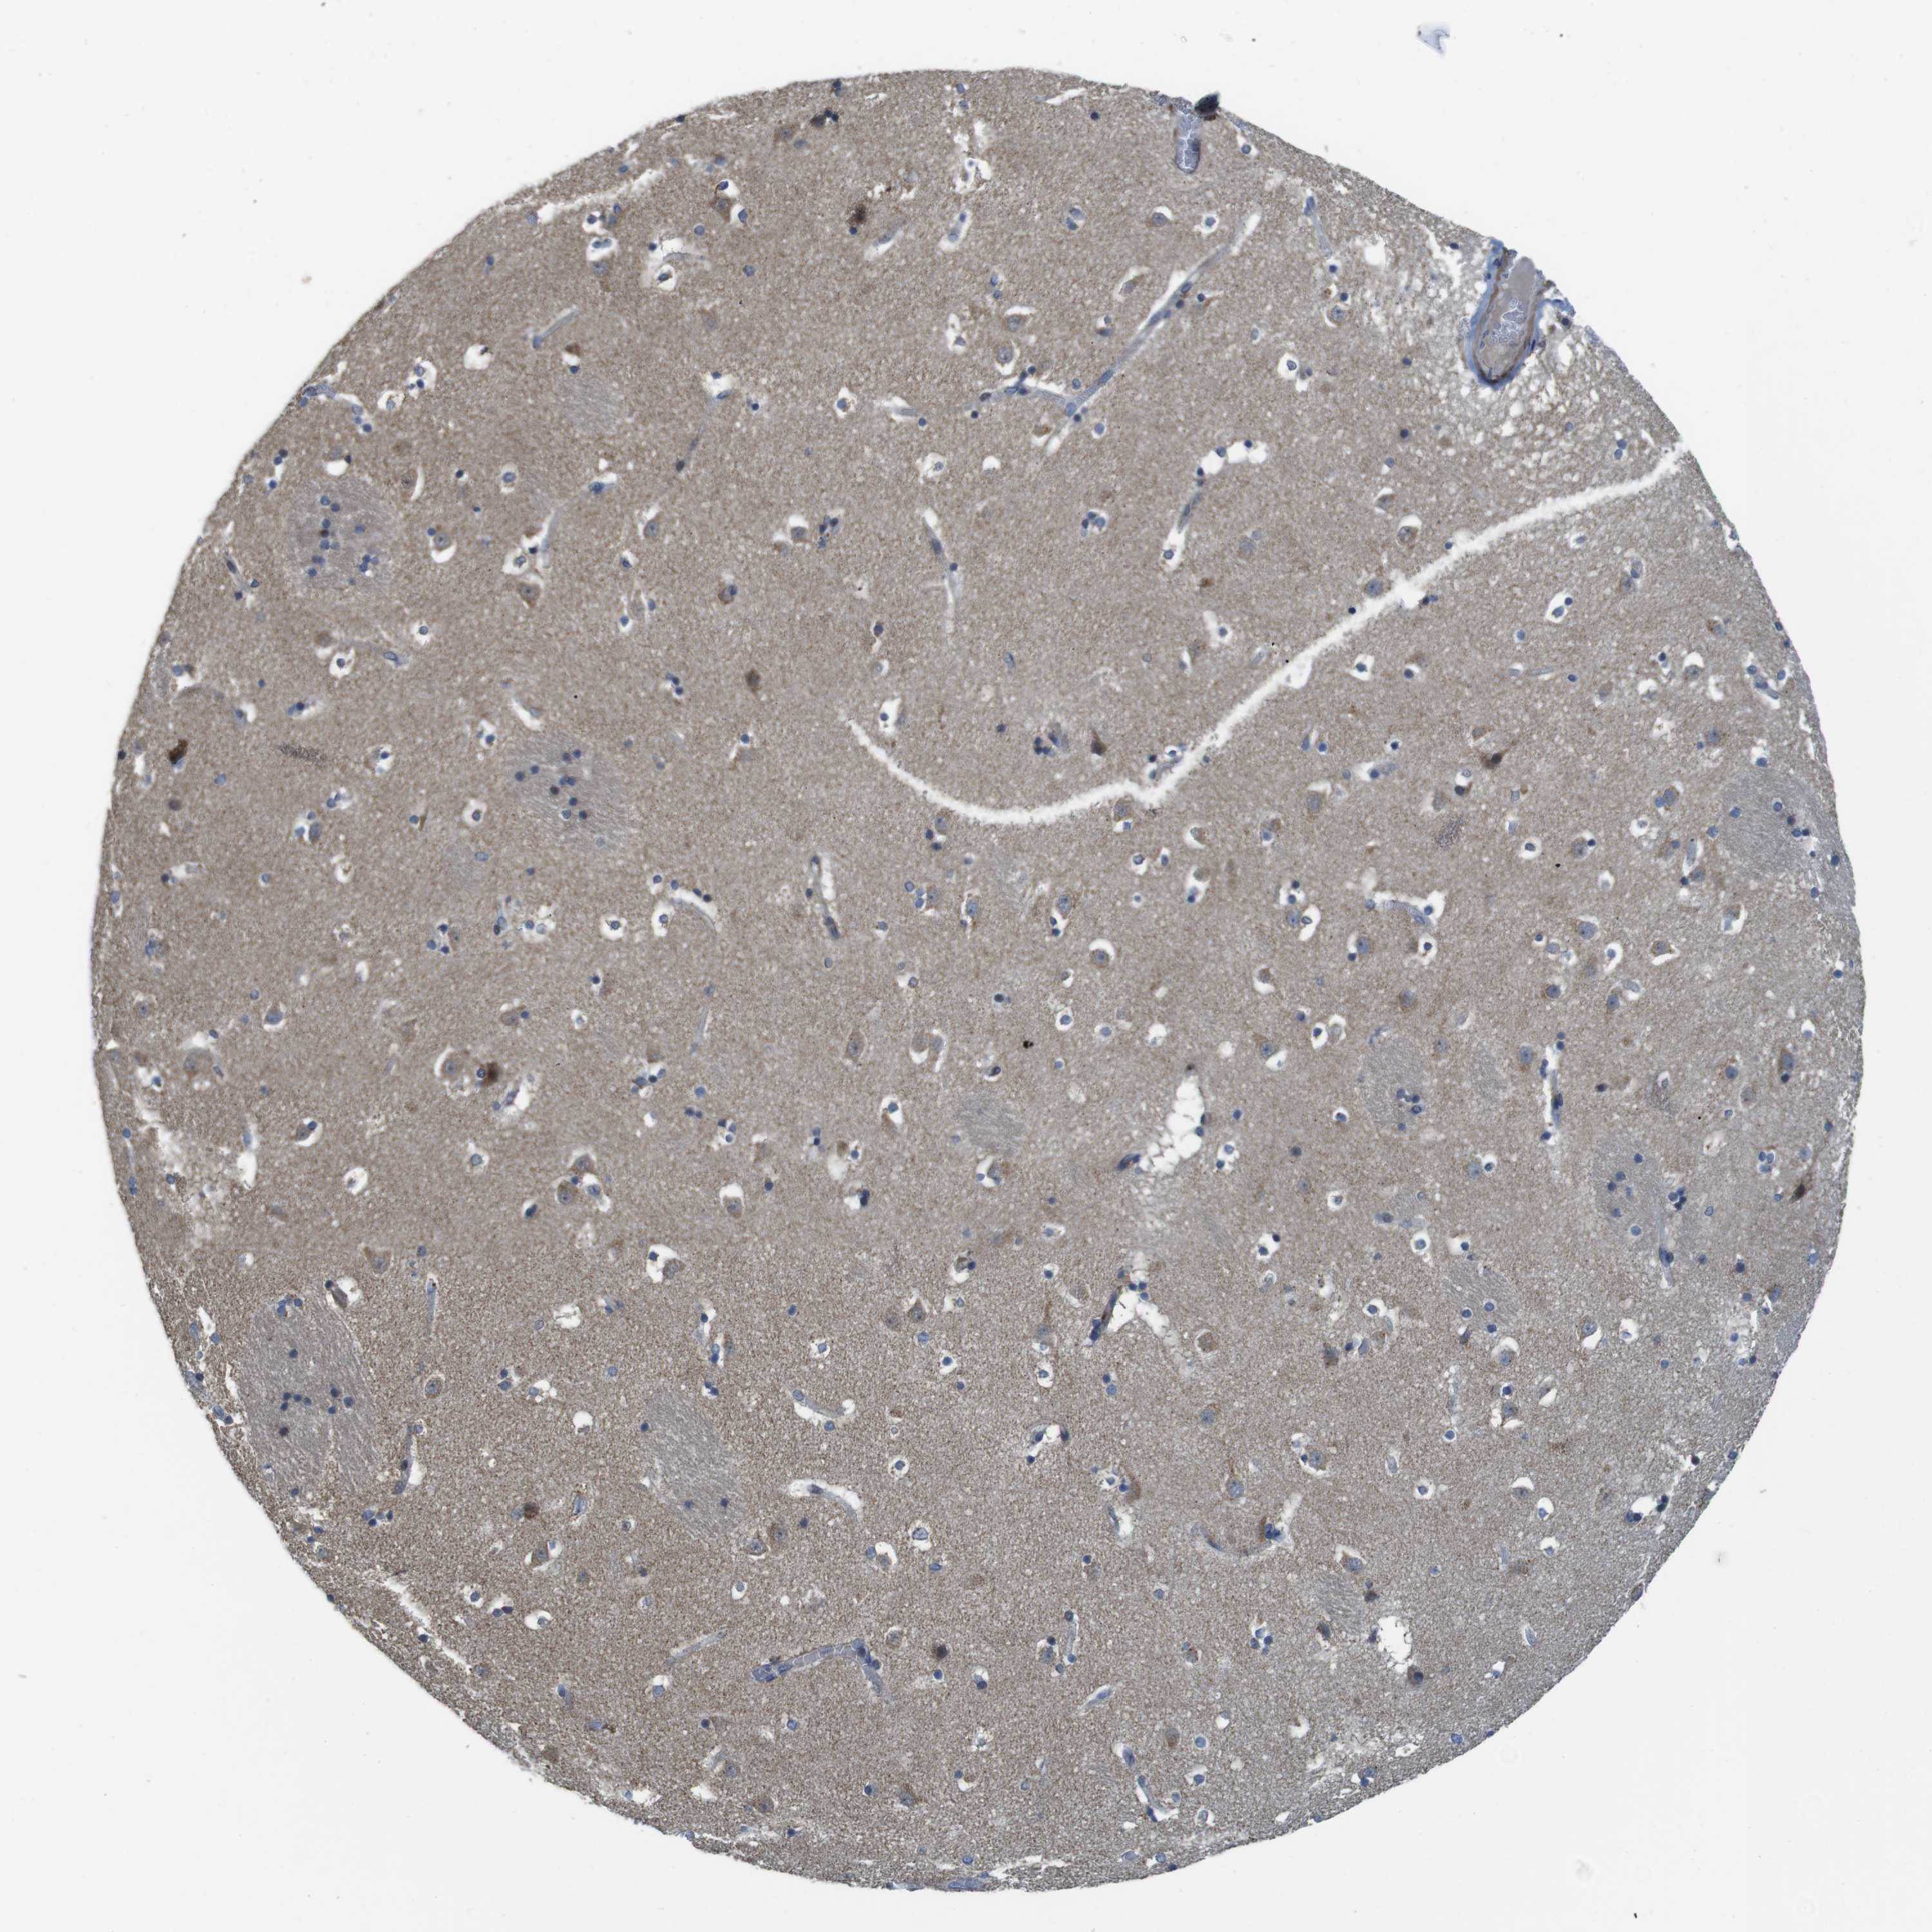
Protein expression
RNA expression
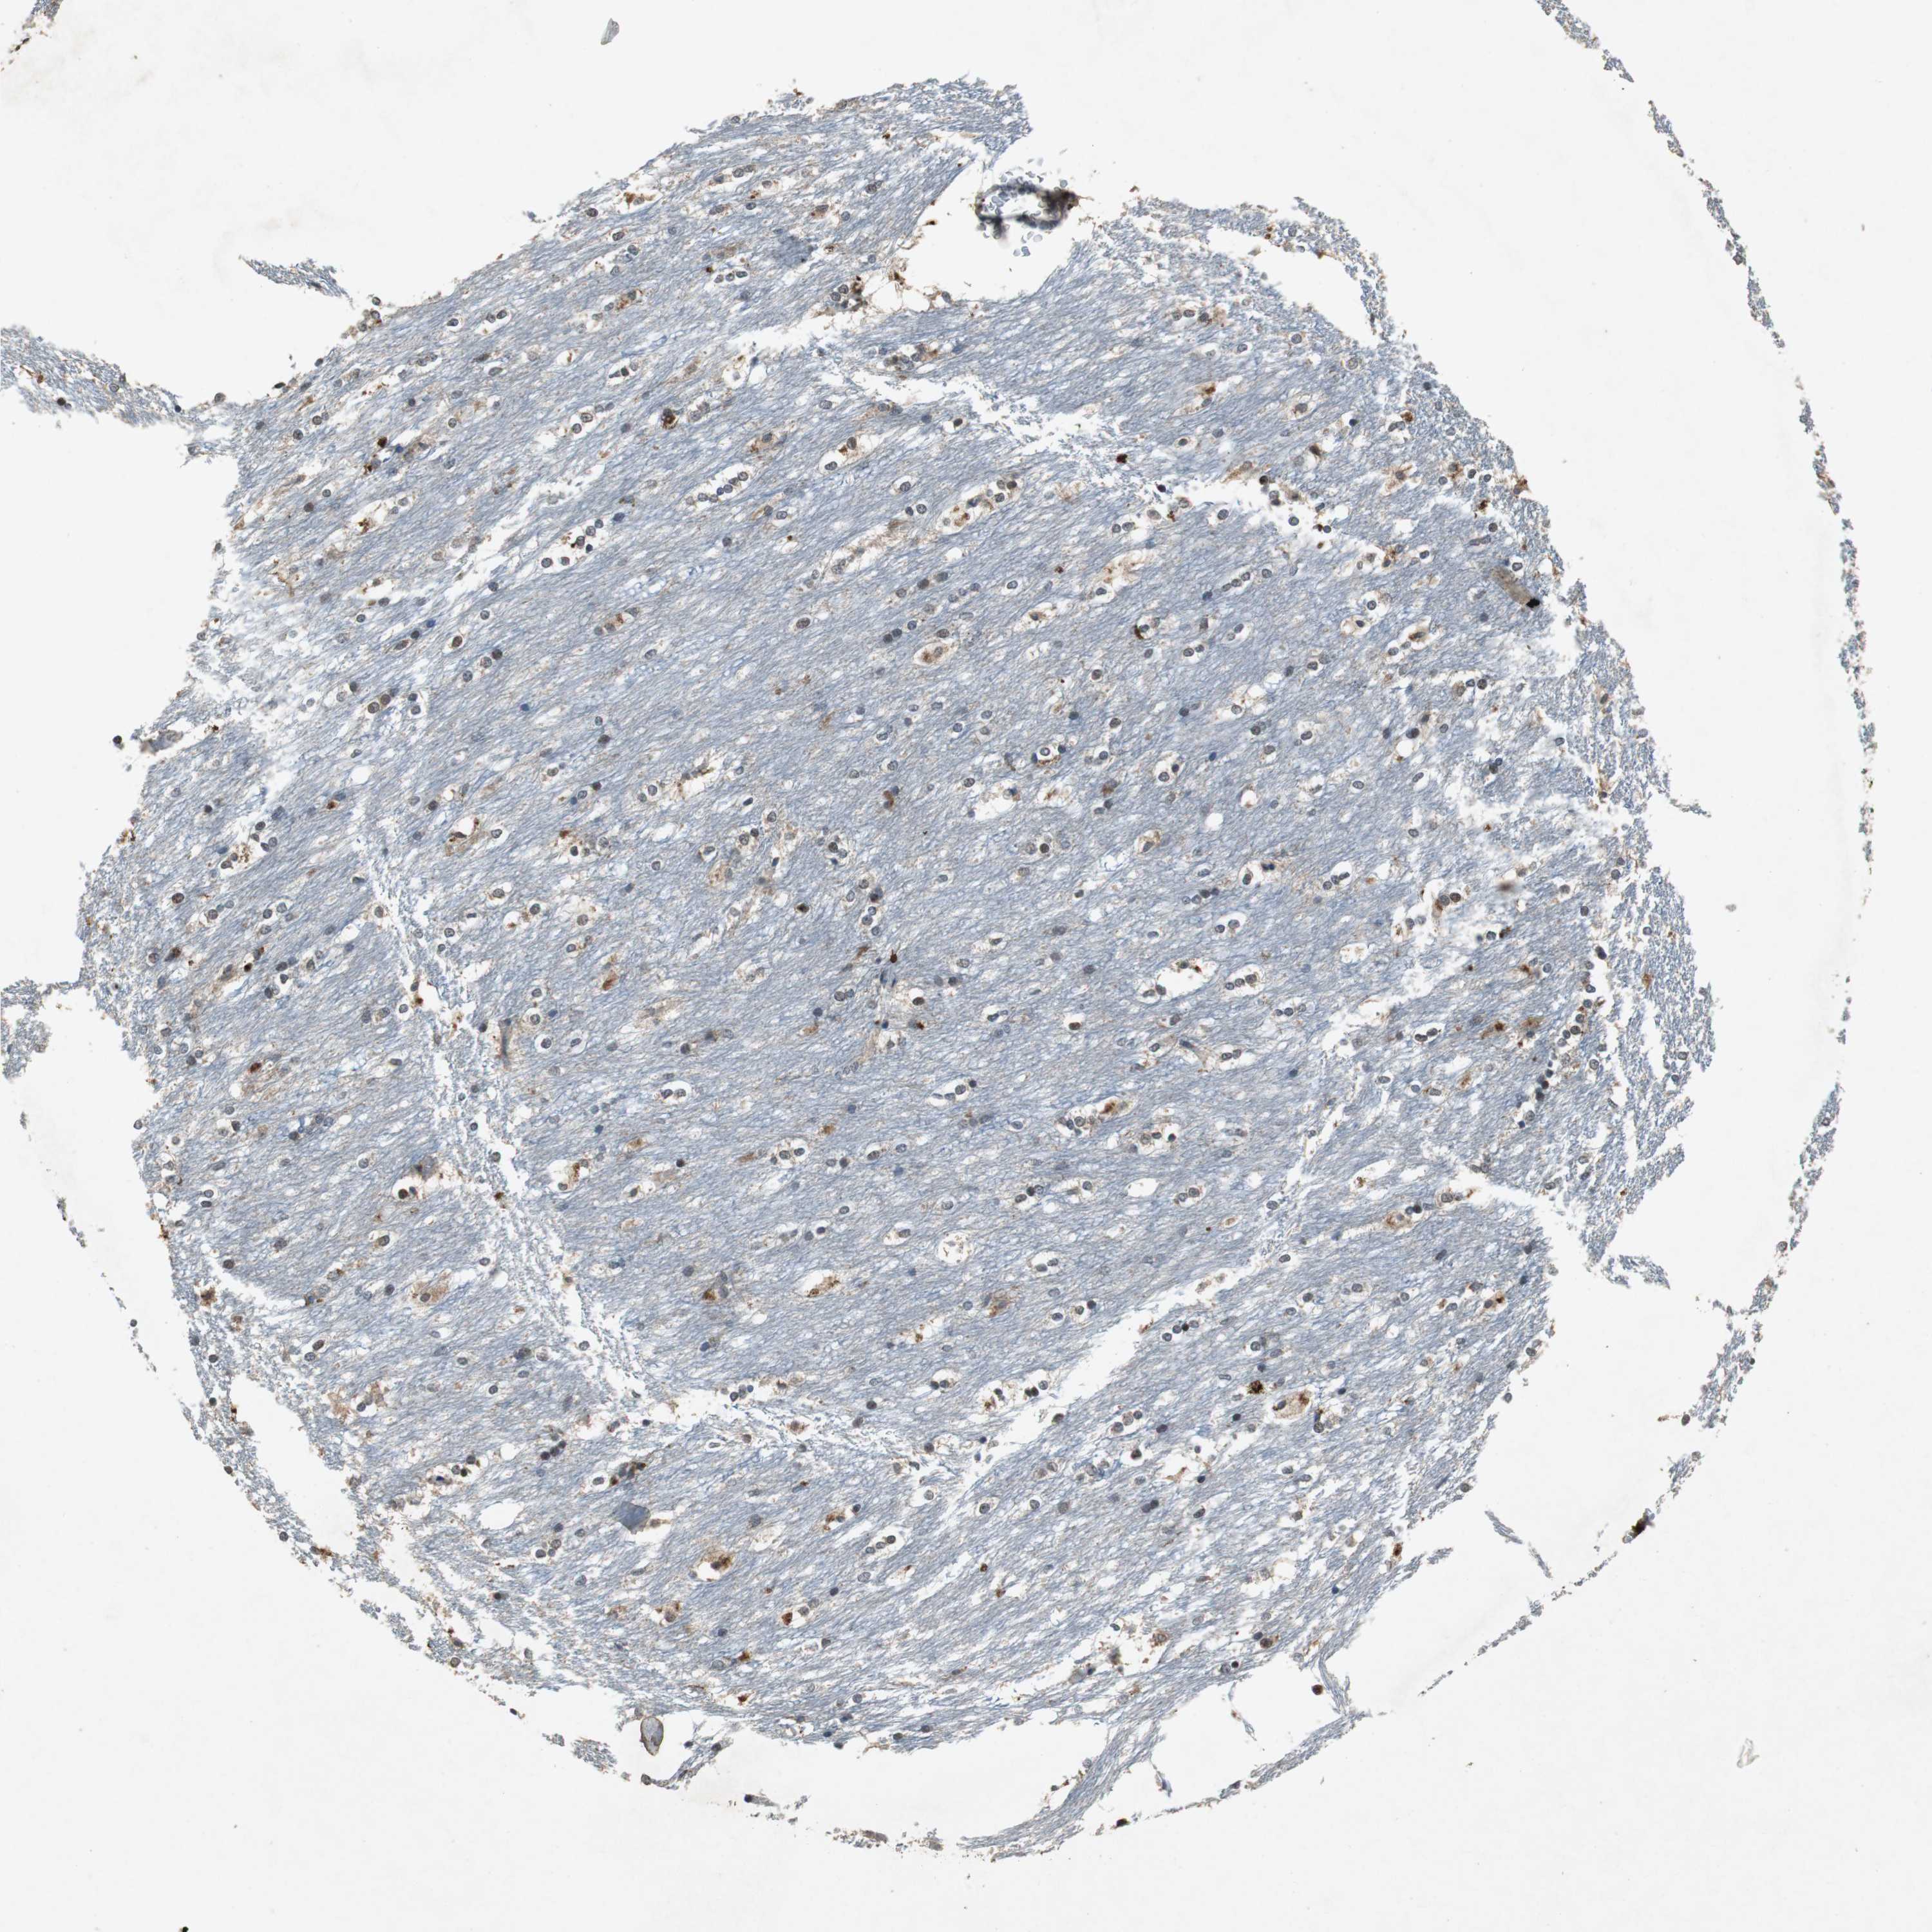
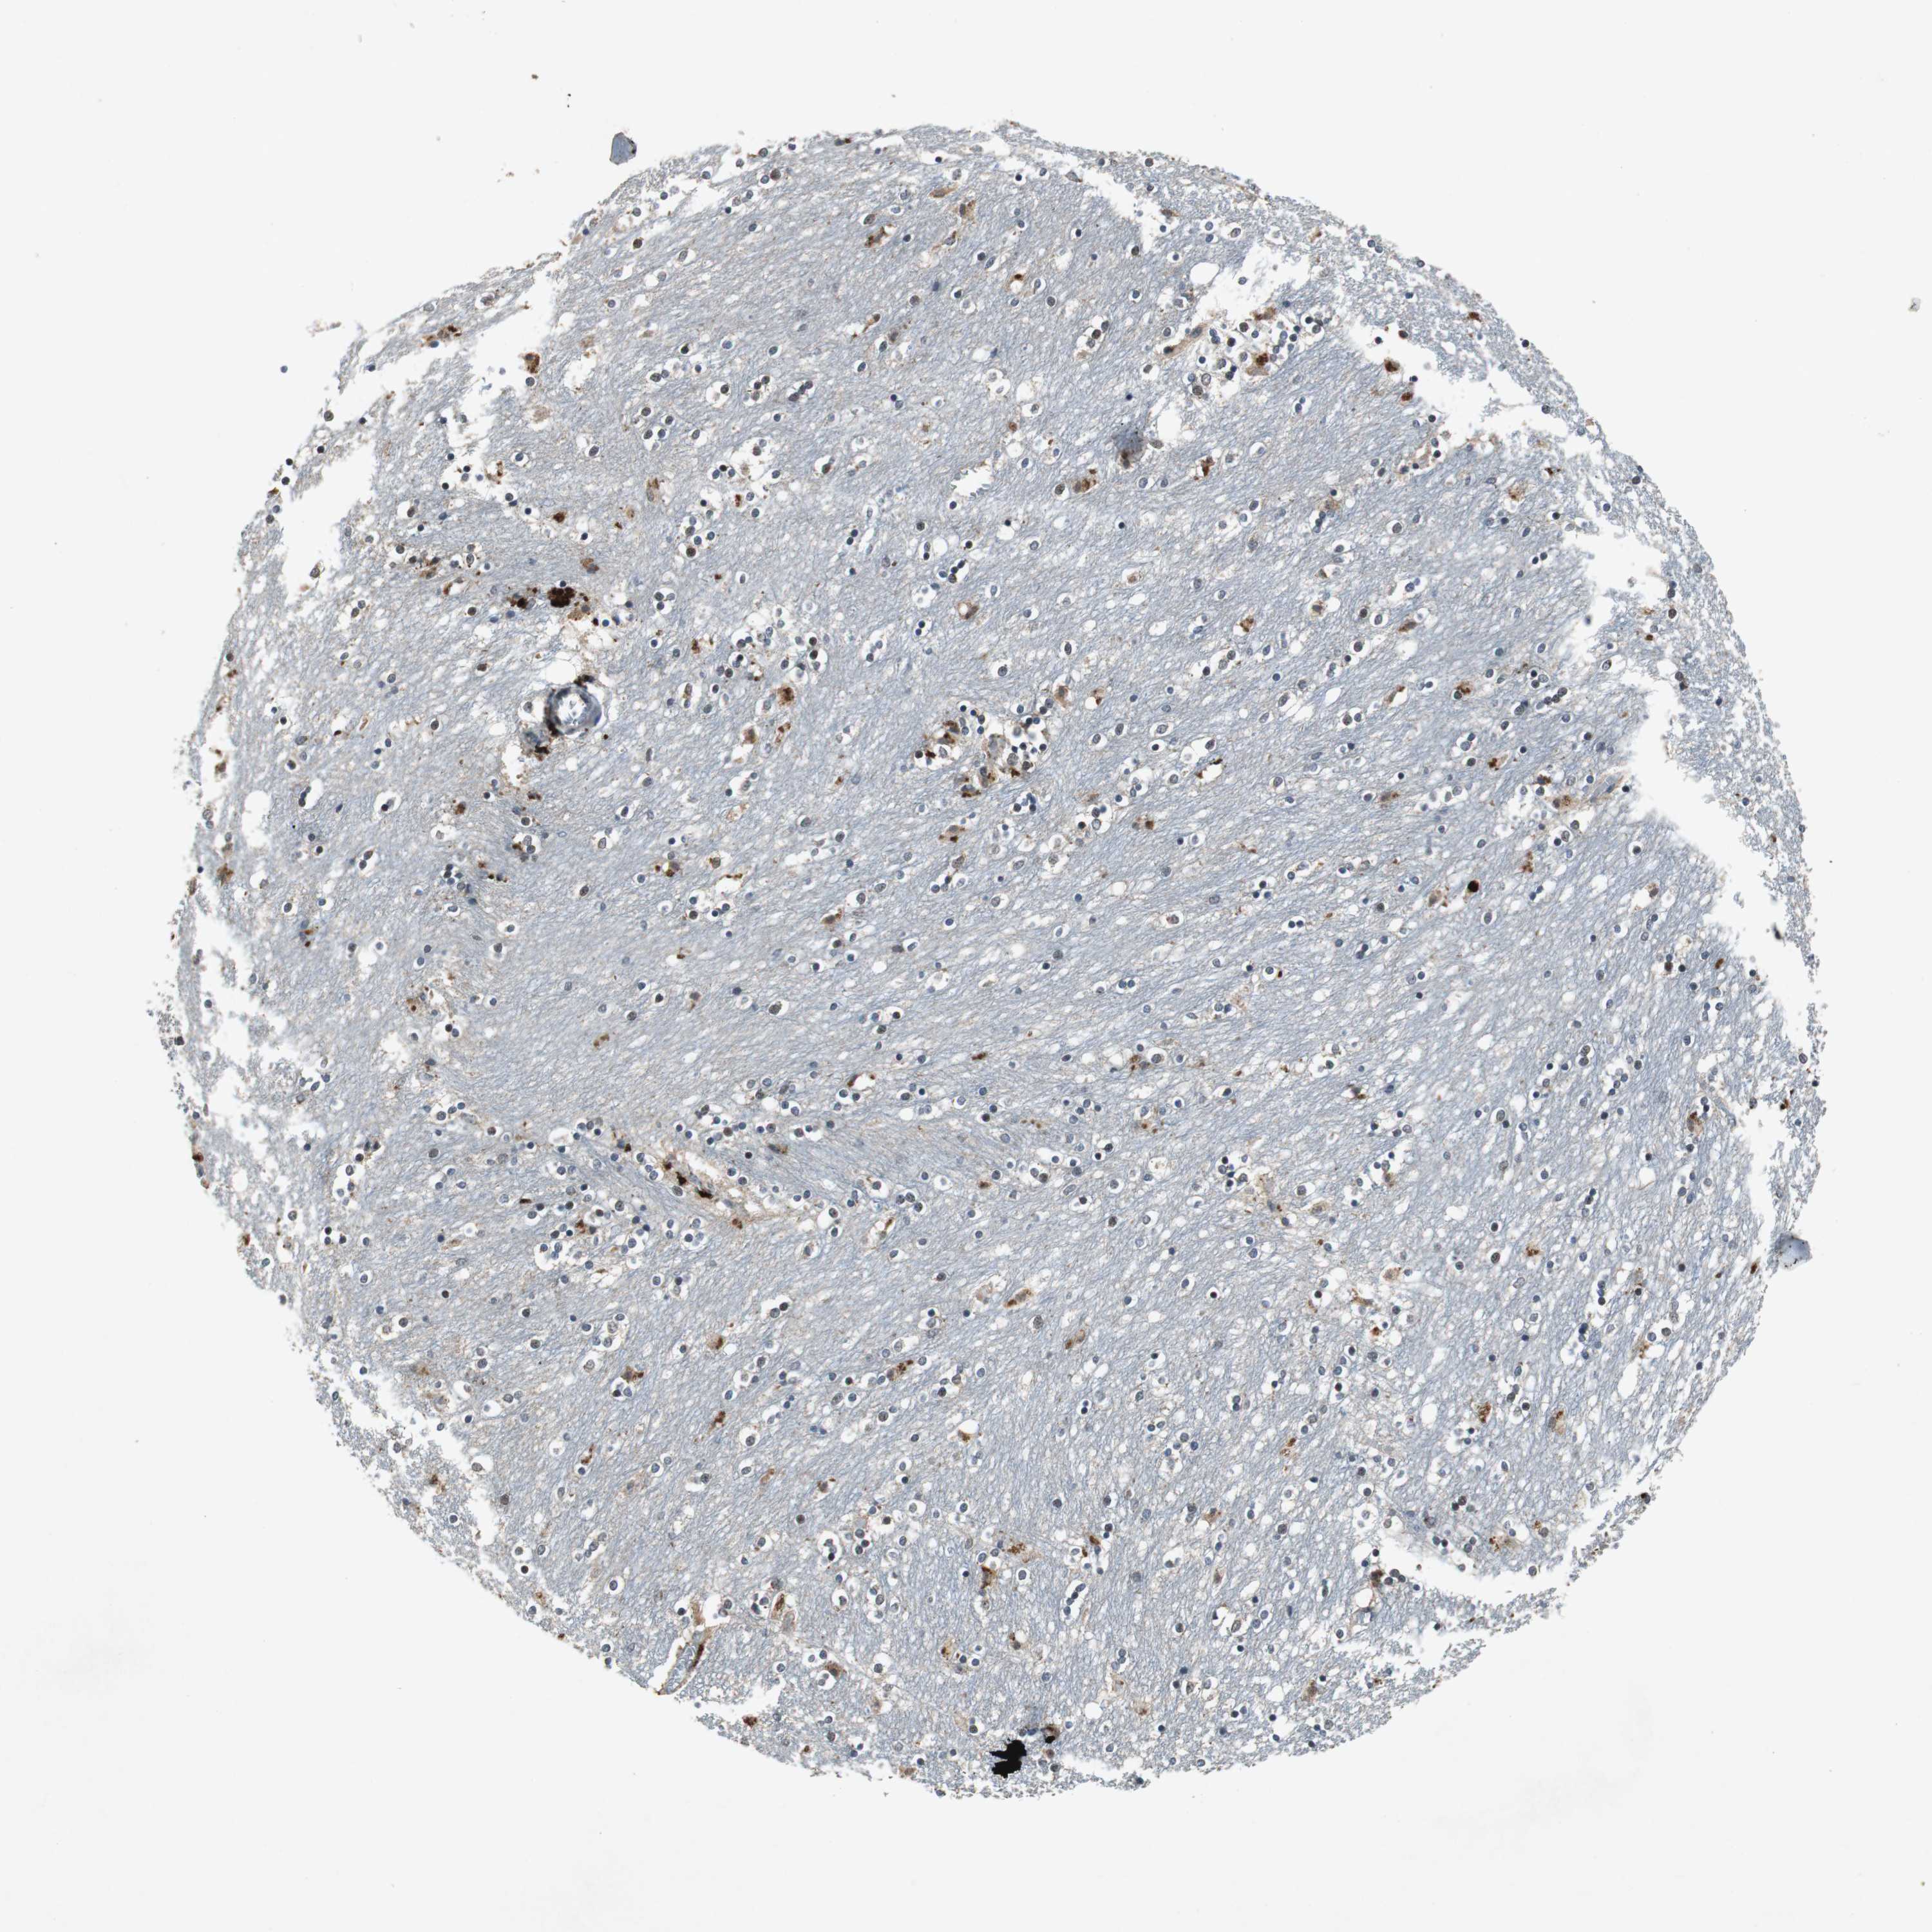
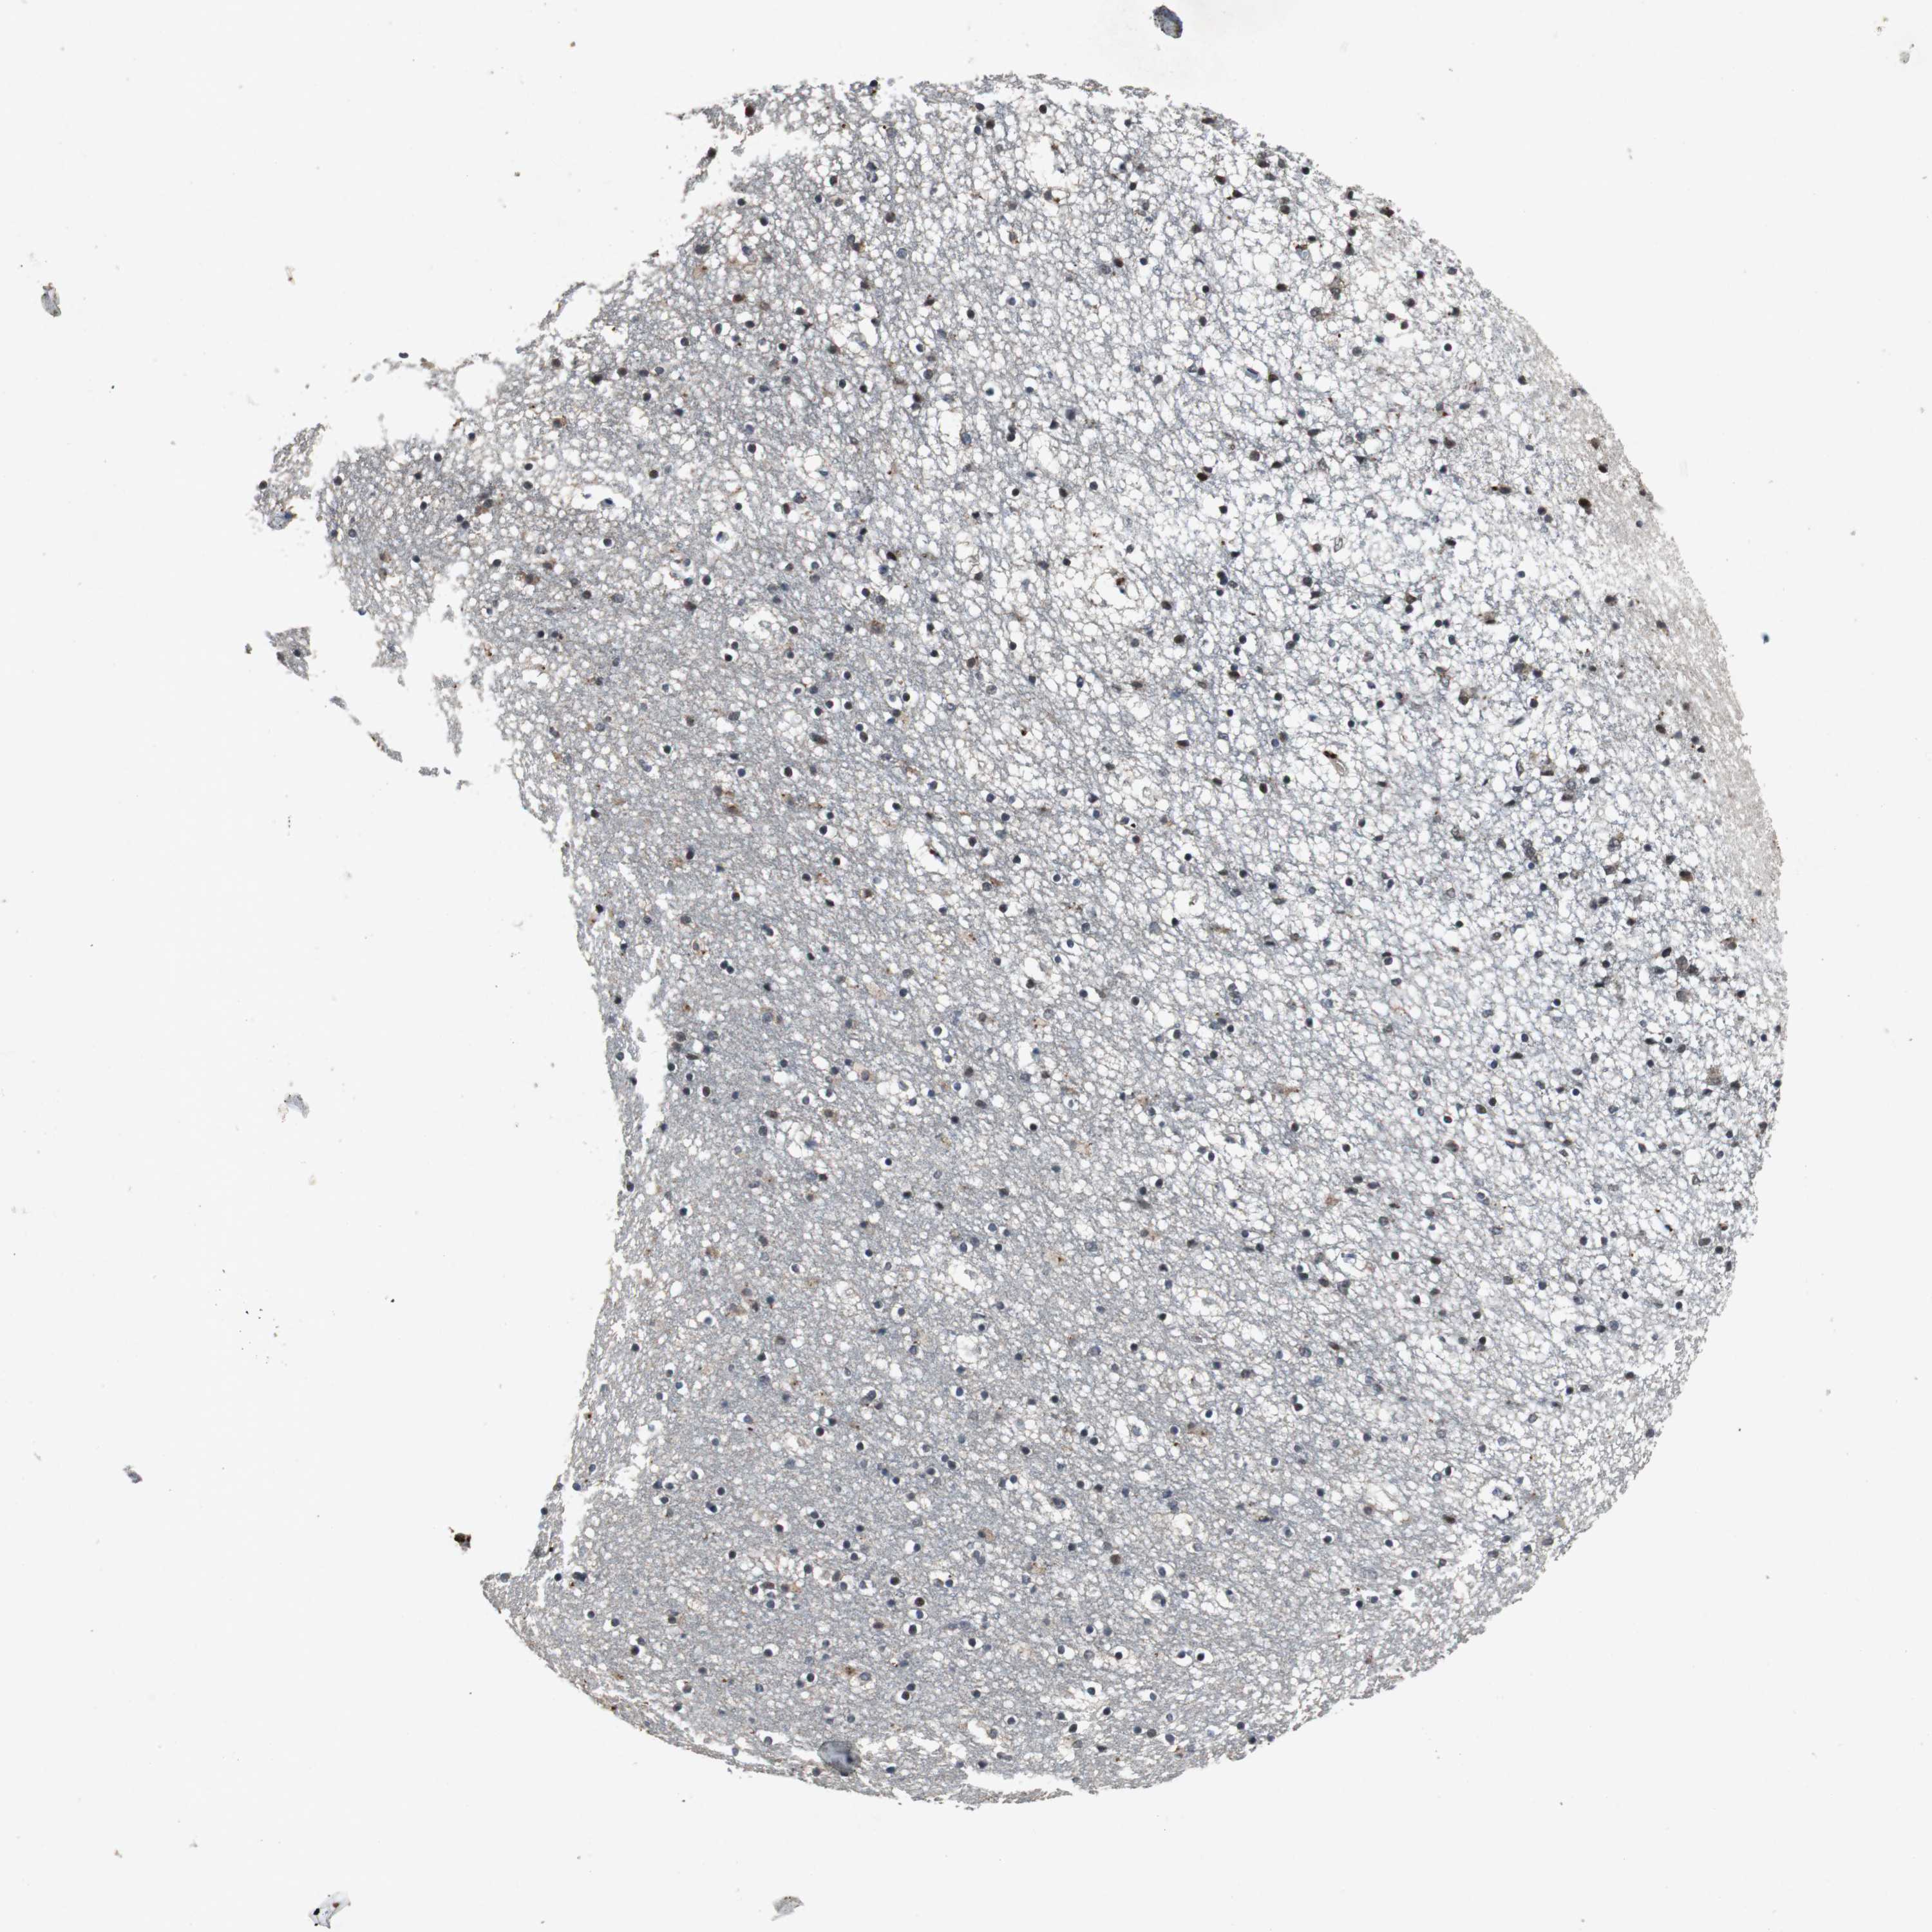
CAUDATE - Annotated protein expression
Annotated proteinexpression
Antibody staining
Antibody HPA014738
Antibody CAB004678
Glial cells
Neuronal cells
CAUDATE - HPA RNA-seq
Pending HPA RNA-seq analysis
CAUDATE - GTEx RNA-seq
Average RPKM
26.5
GTEx sample id
RPKM
Brain - Caudate (basal ganglia)
CAUDATE - FANTOM5 CAGE
Average Tags Per Million
65.4
FANTOM5 sample id
Sample description
Tags Per Million