- THE HUMAN PROTEOME
- THE HUMAN TISSUES
- THE HUMAN CELL
- PROTEIN CLASSES
- PROTEIN EVIDENCE
- NEWS
- BLOG
- EVENTS
- PRESS ROOM
- LEARN
- DICTIONARY
- METHODS
- CELL LINES
|
TISSUE ATLAS
PRIMARY DATA
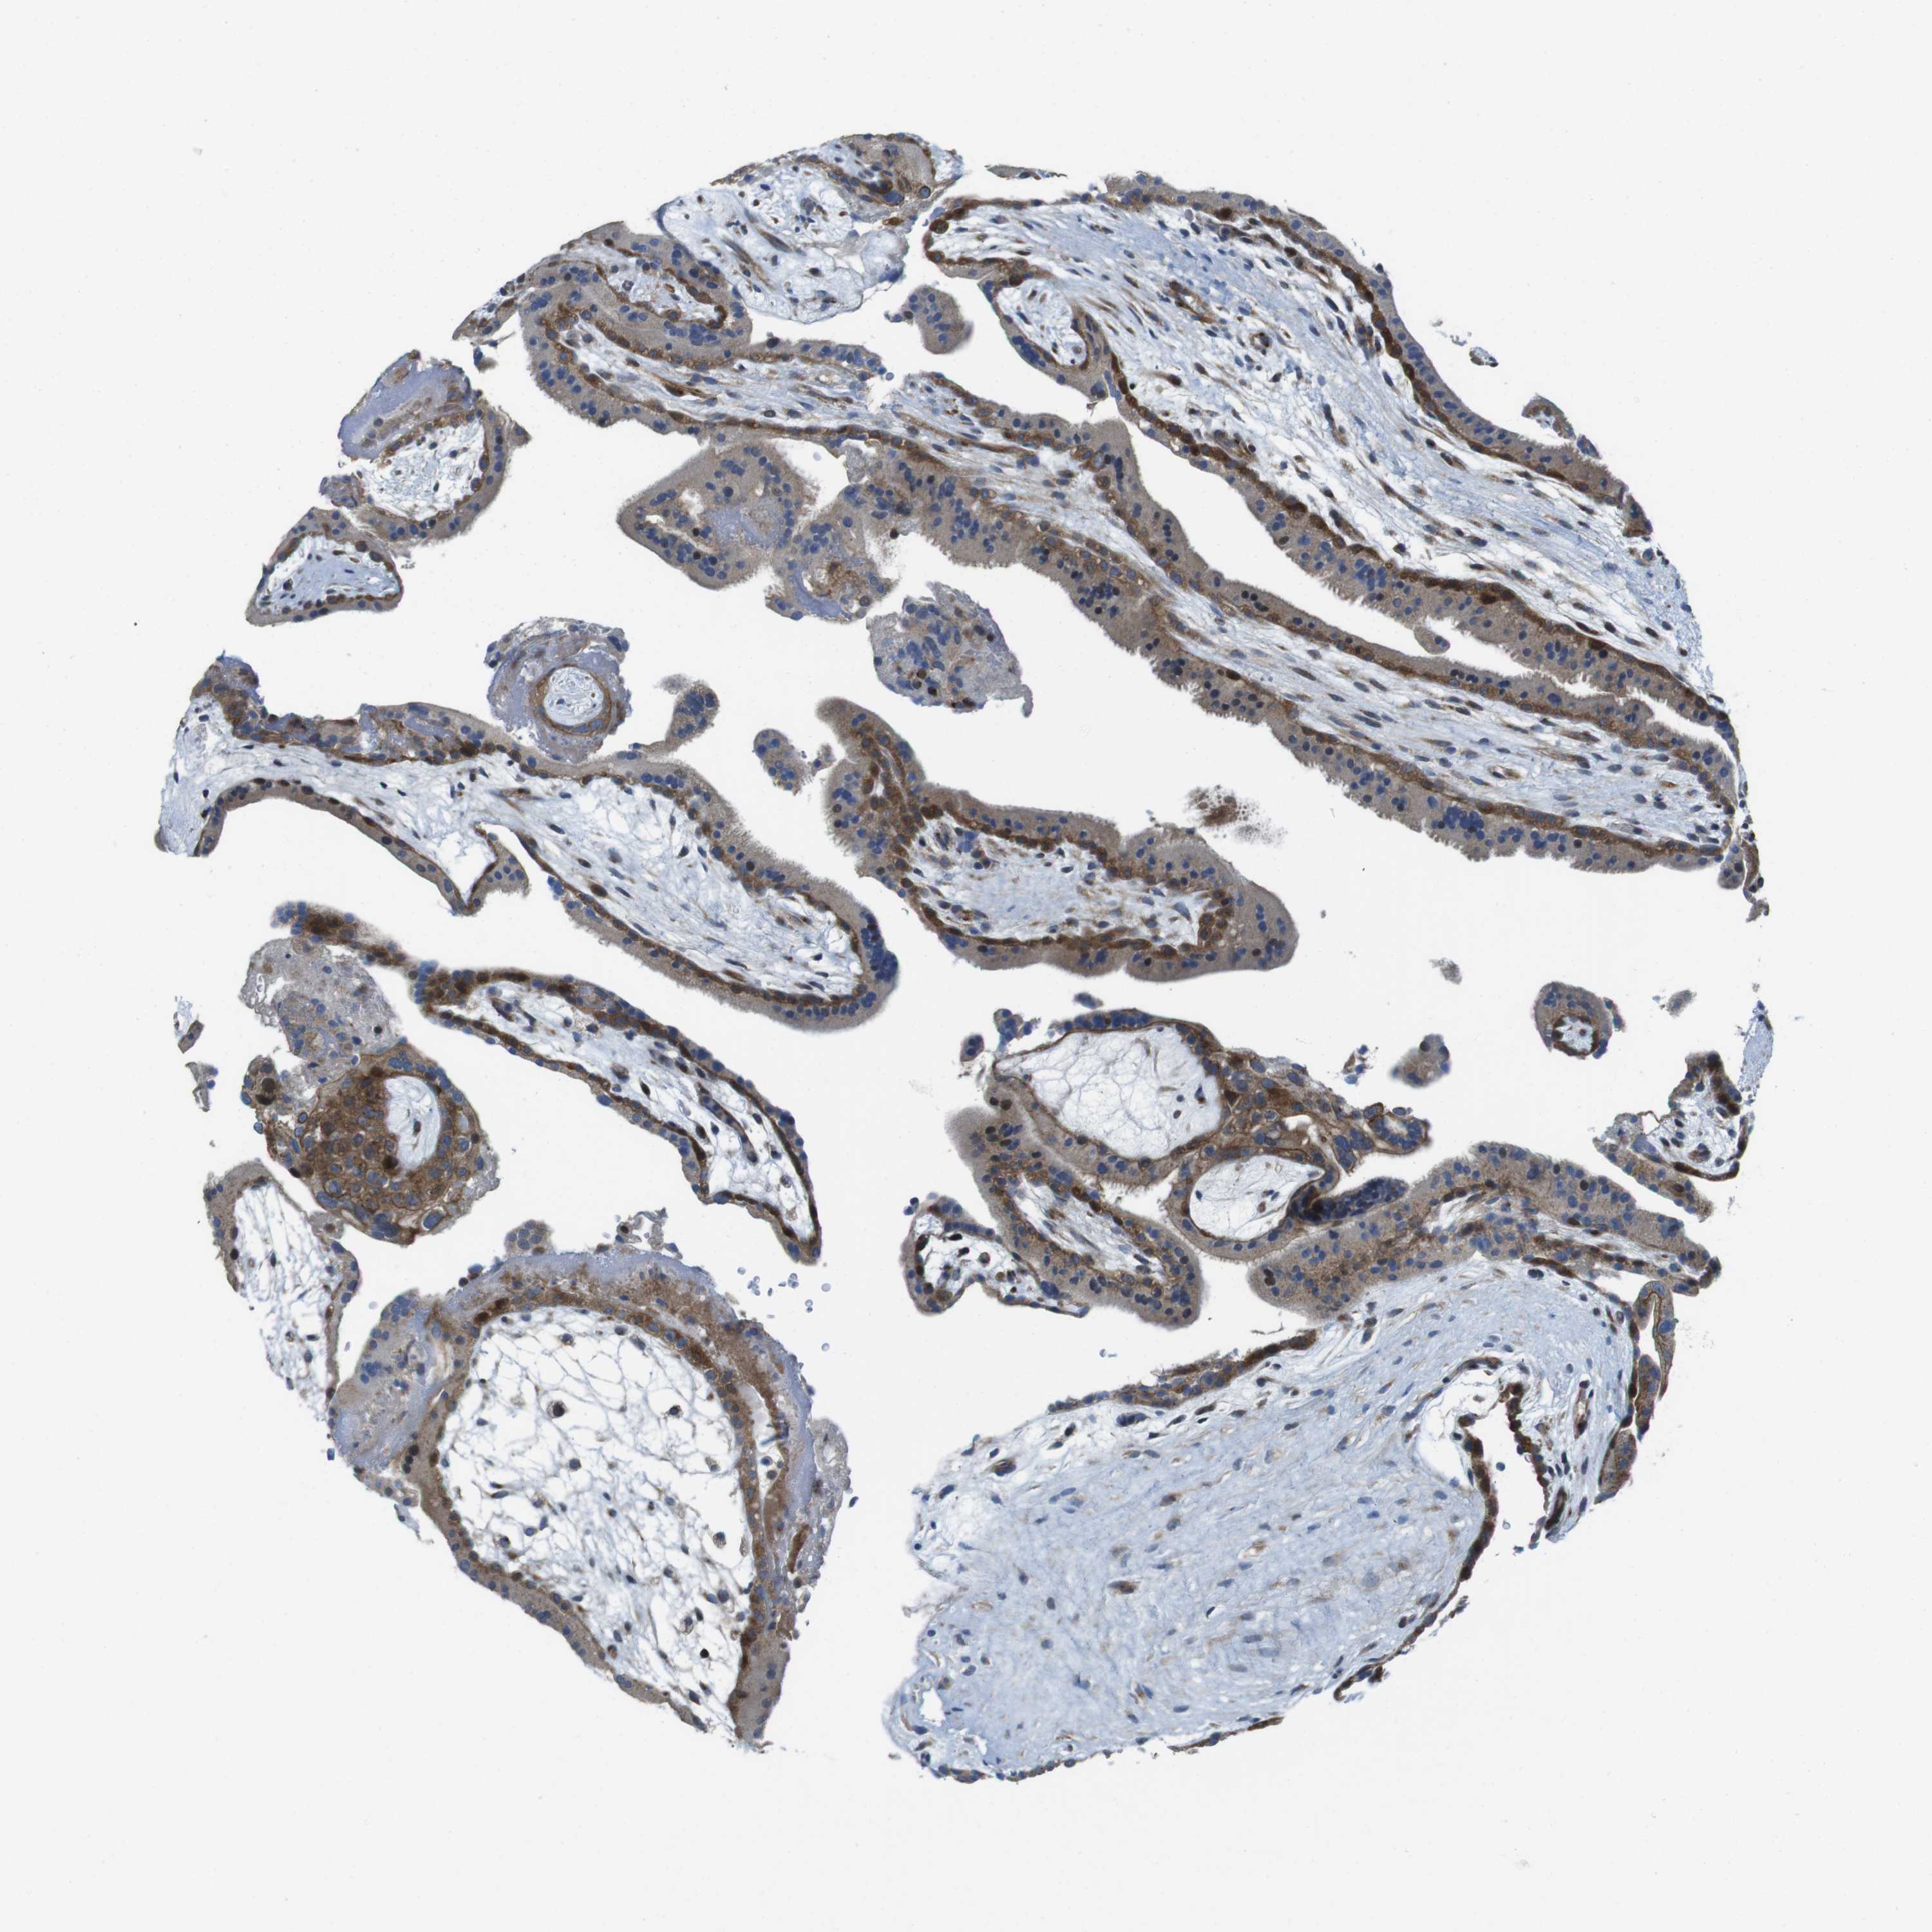
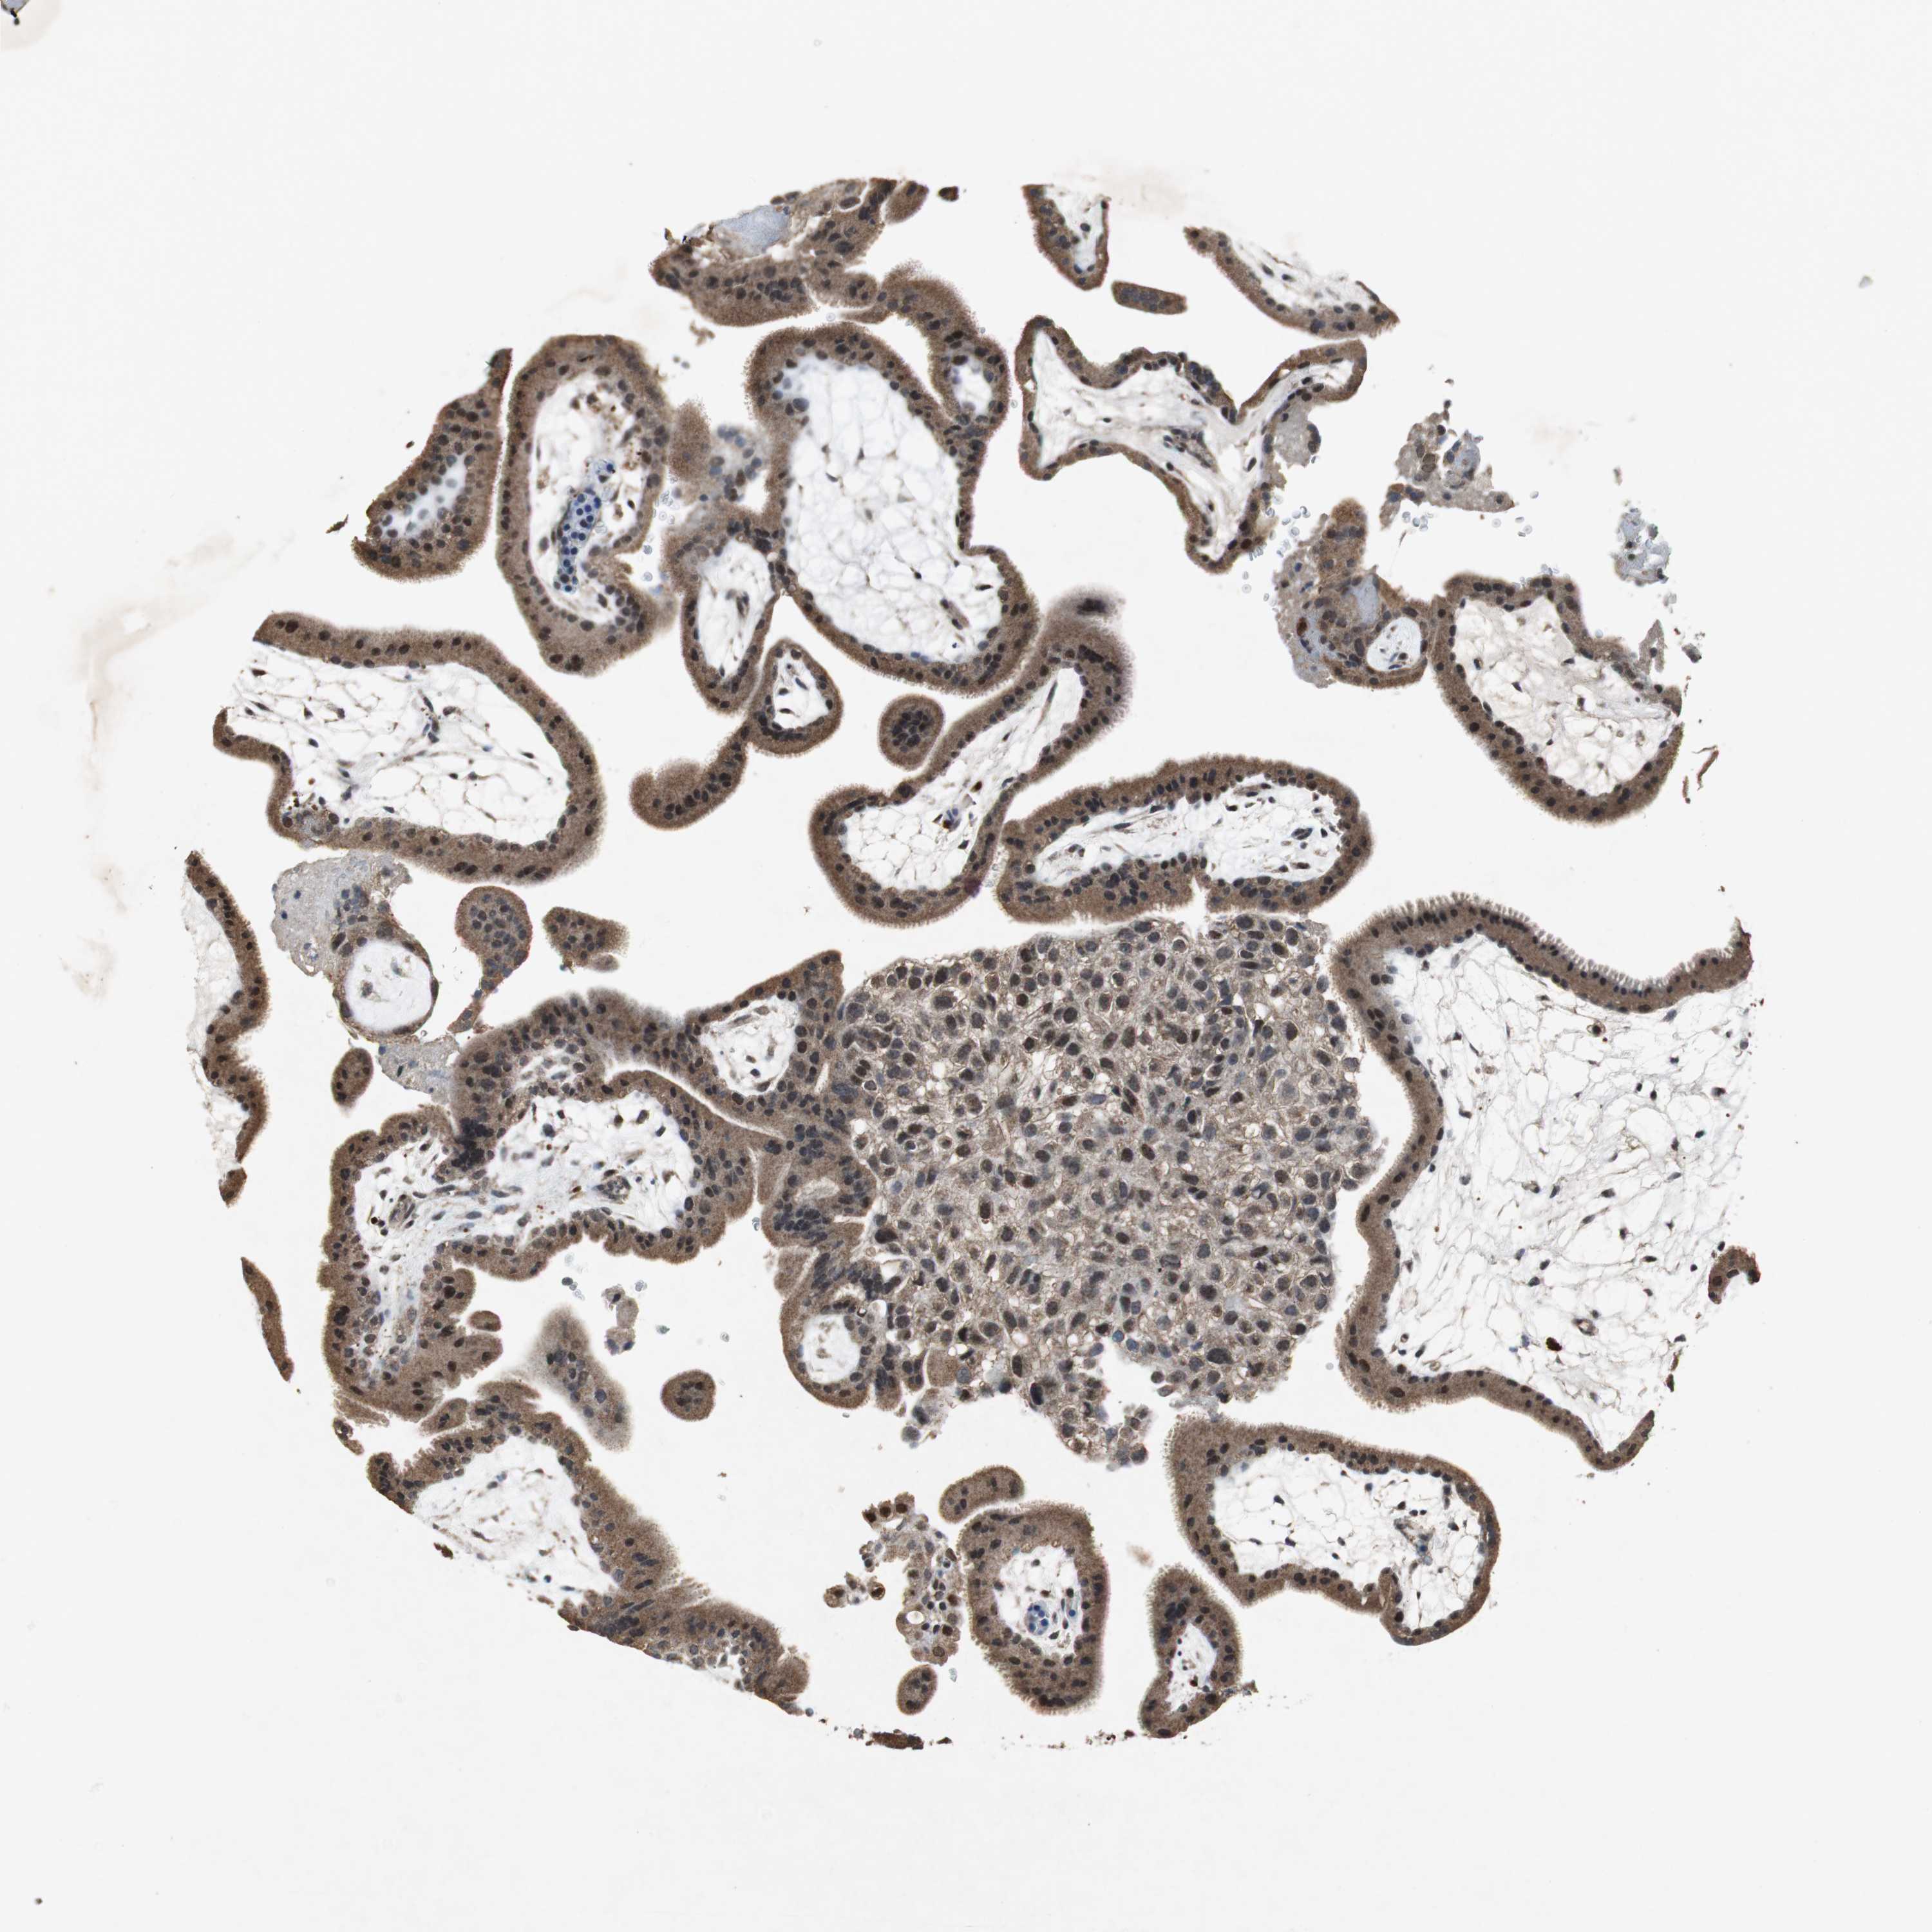
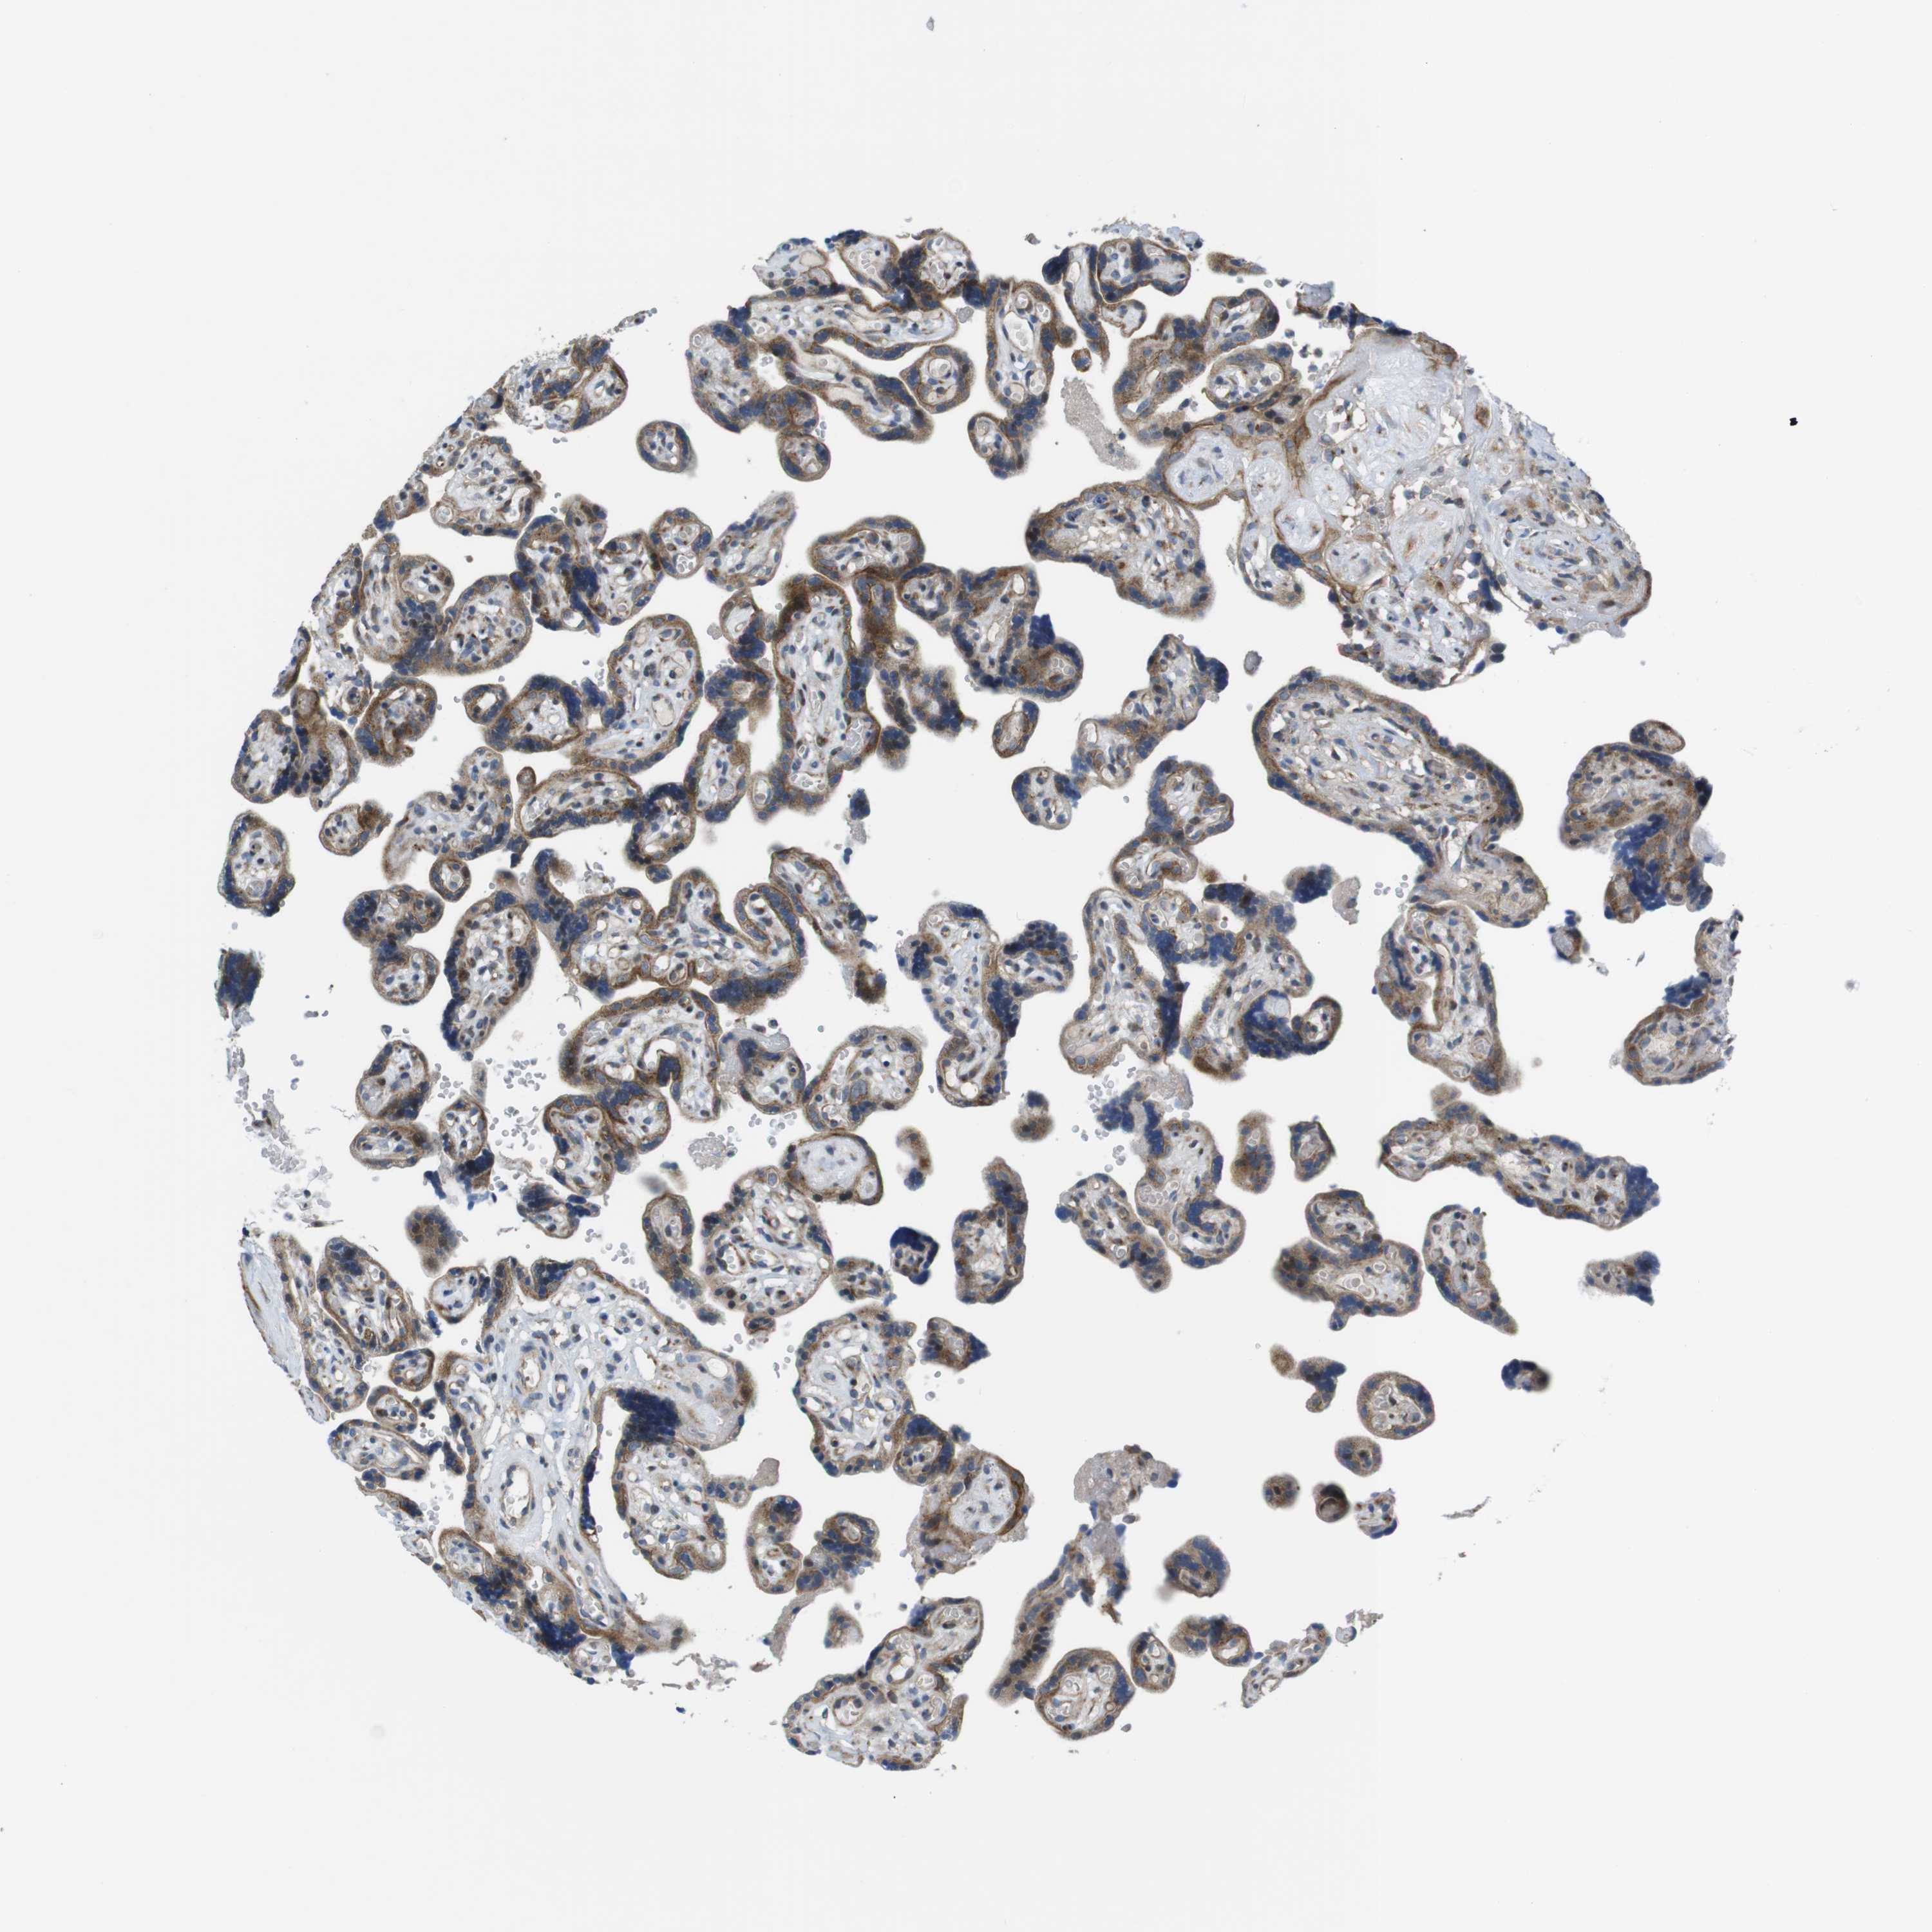
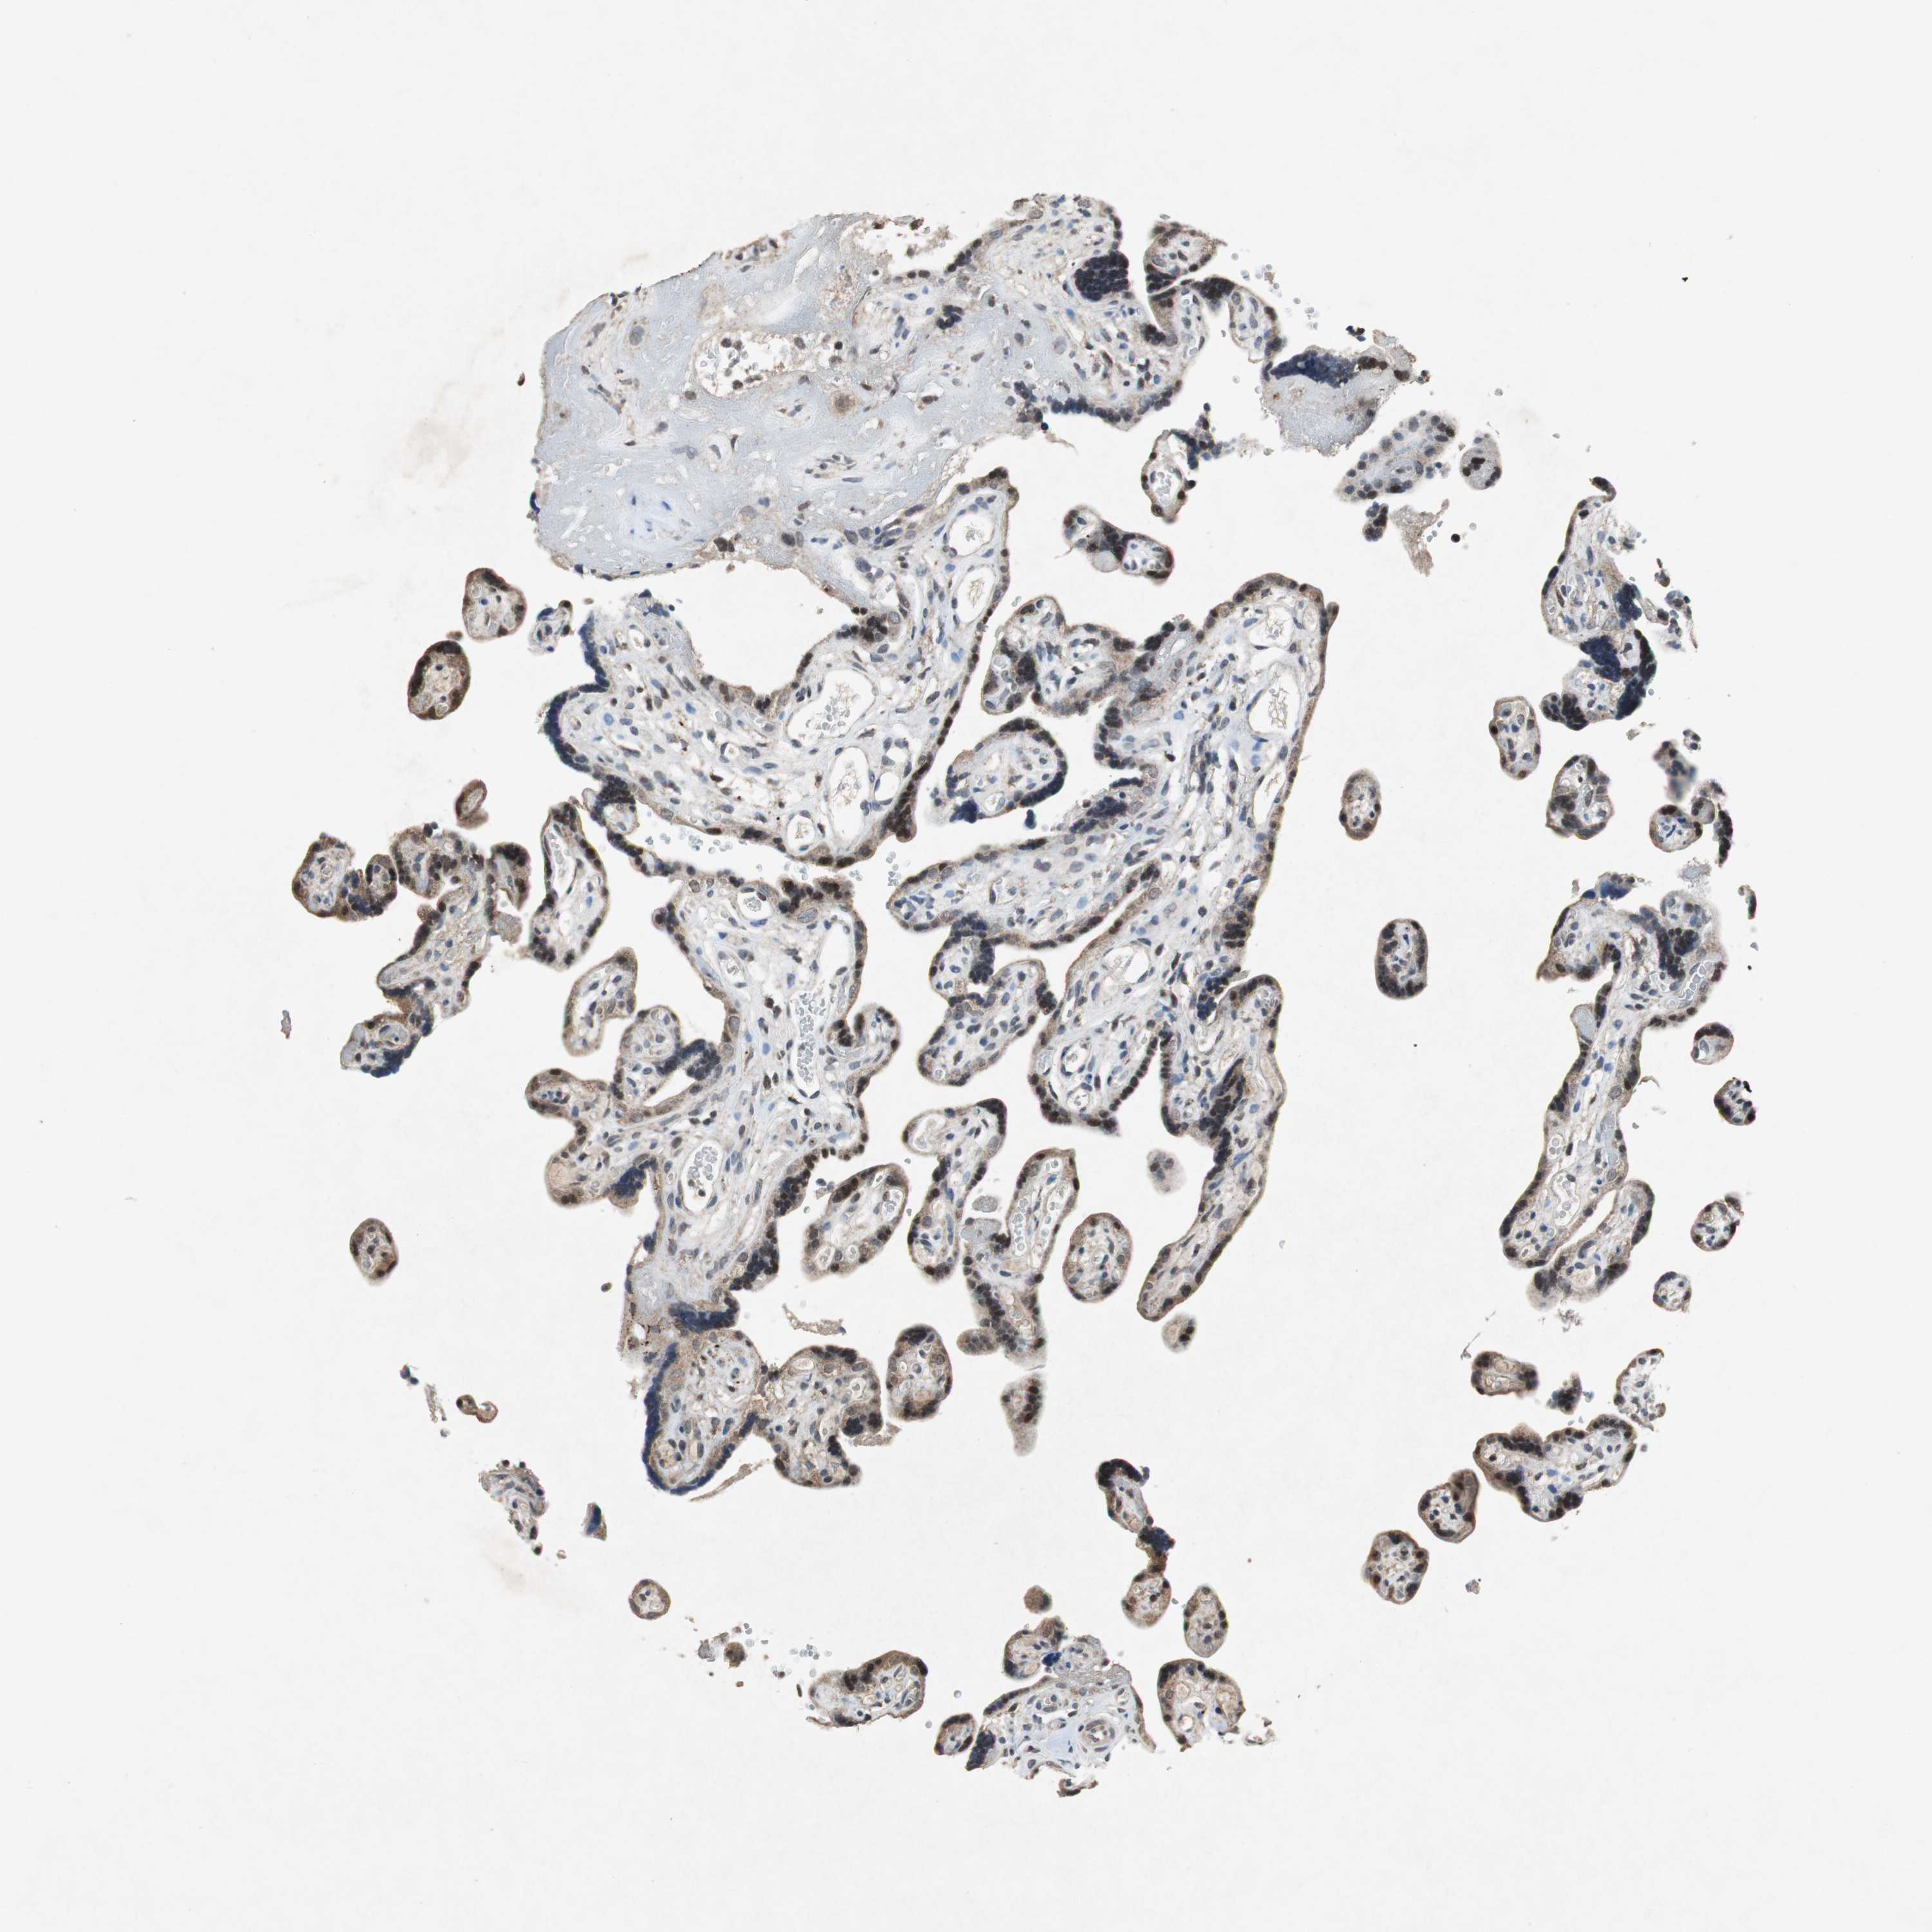
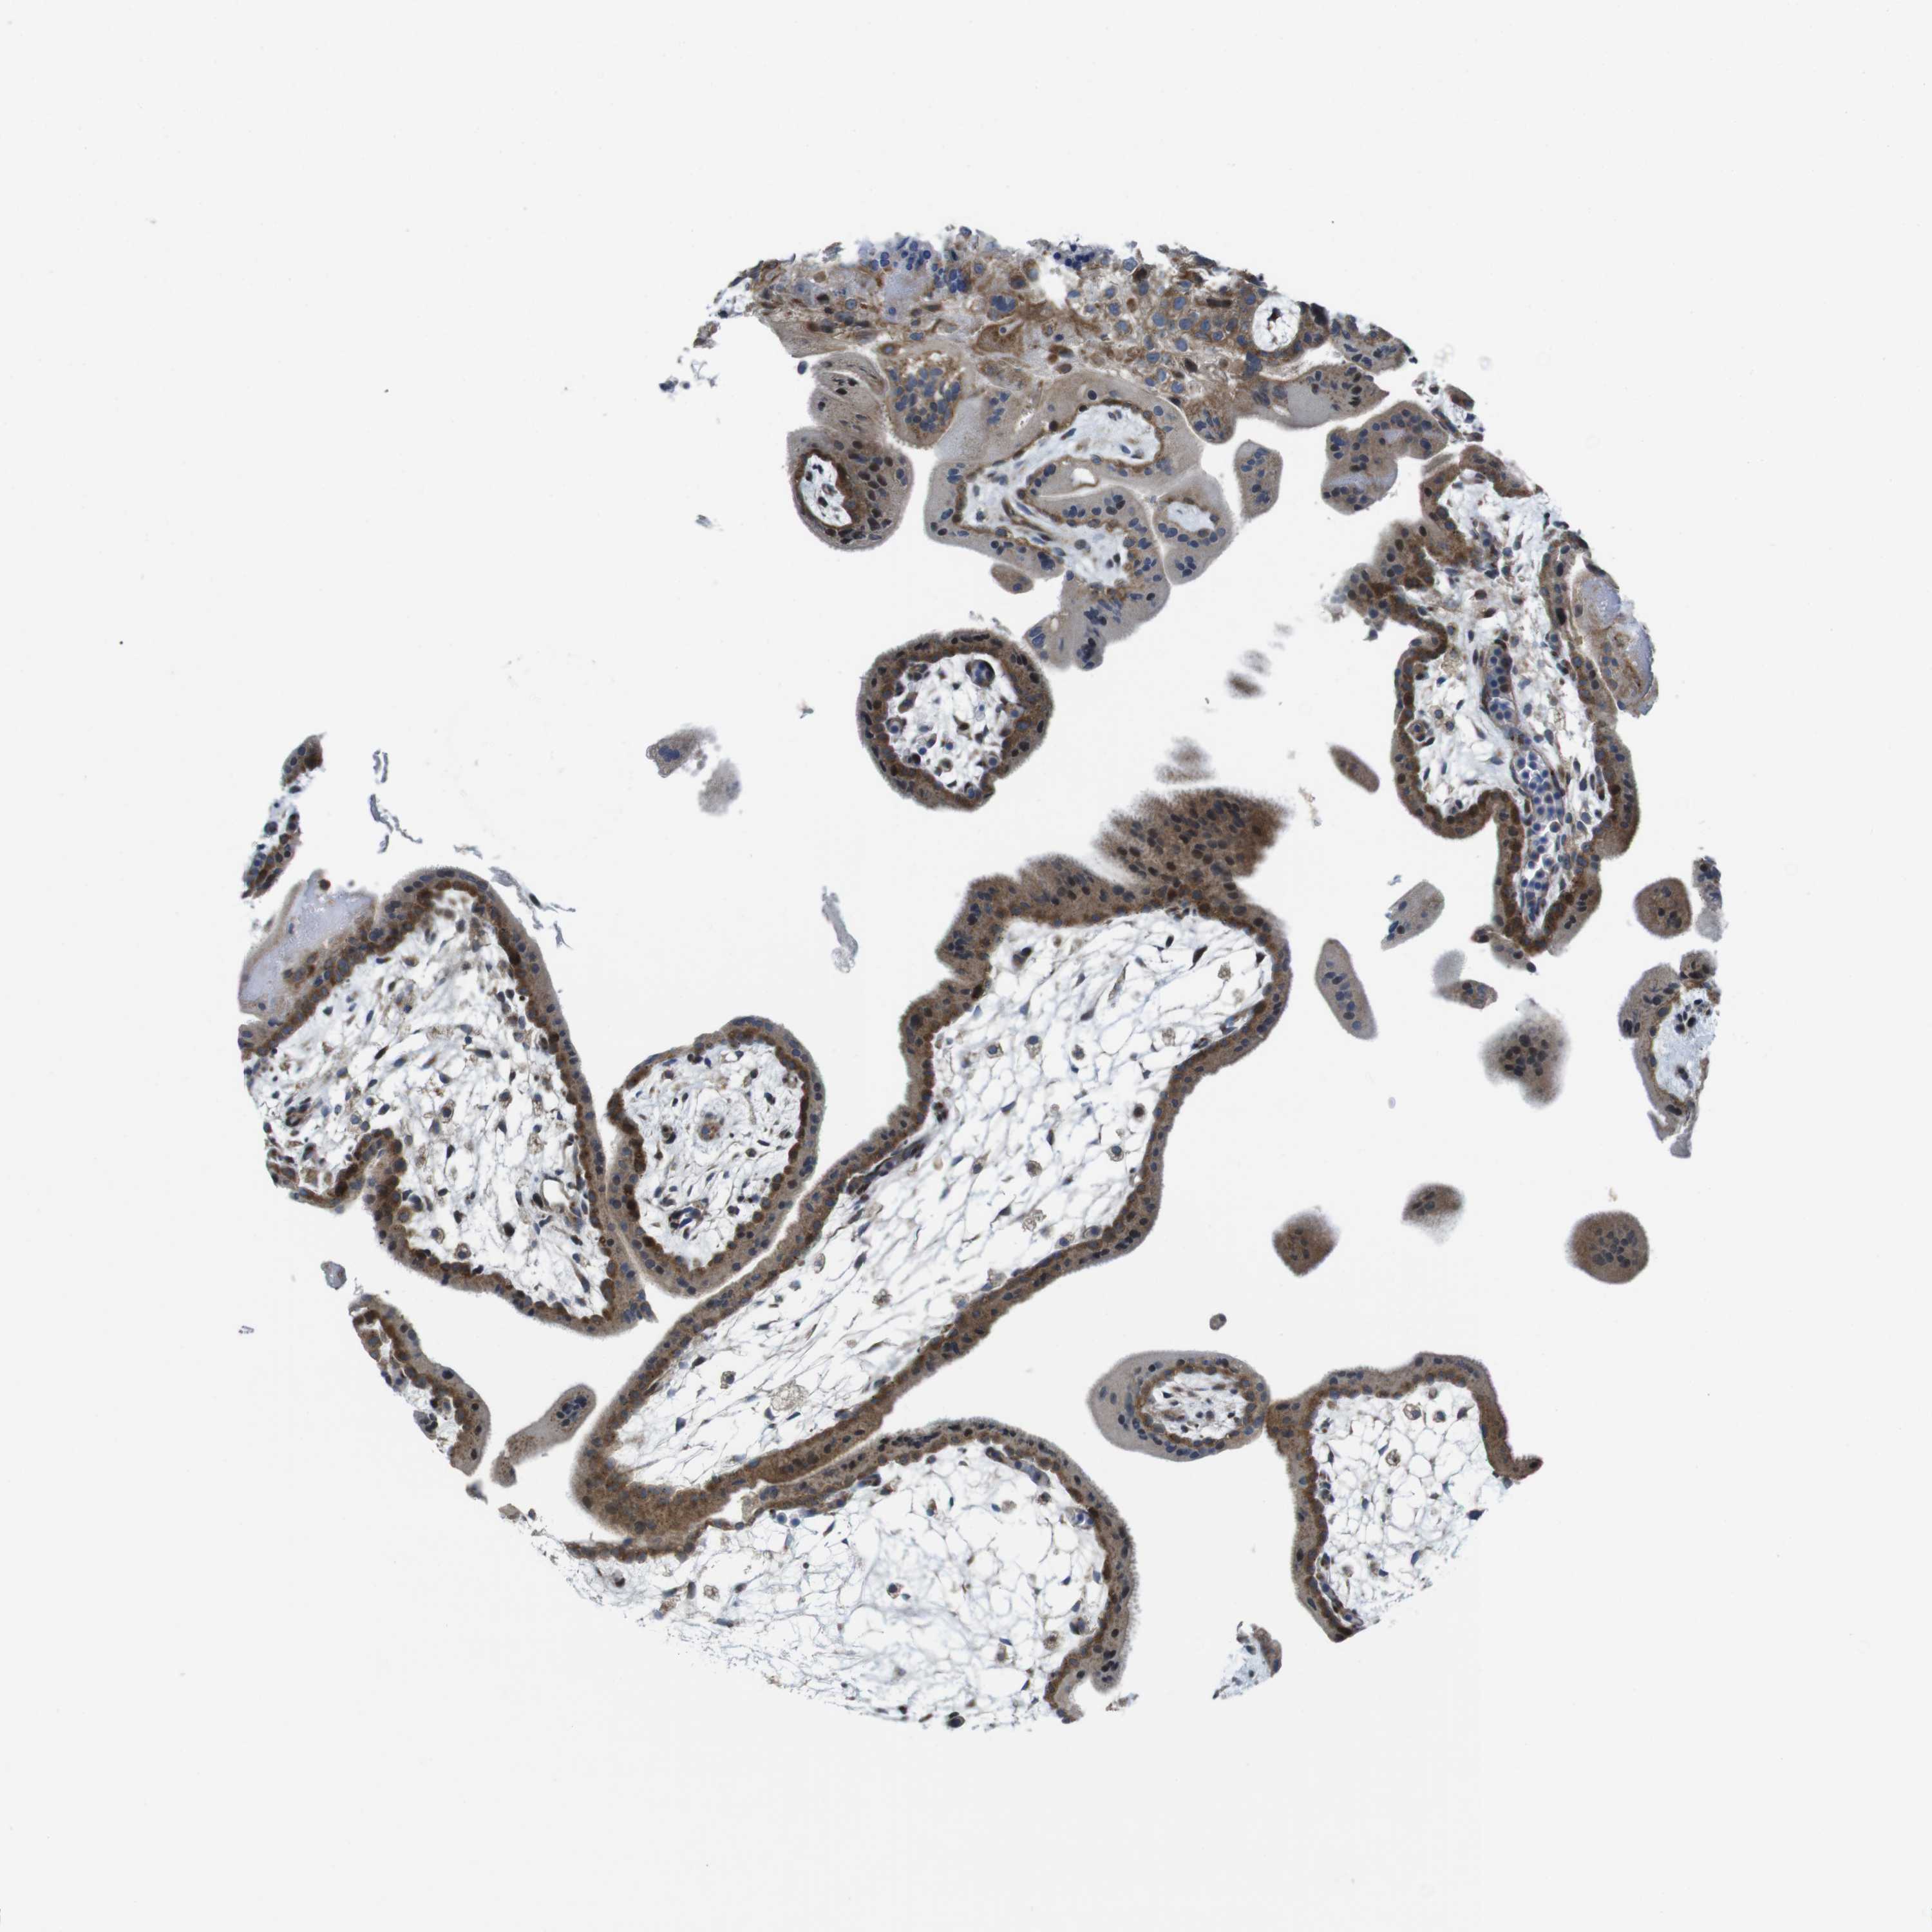
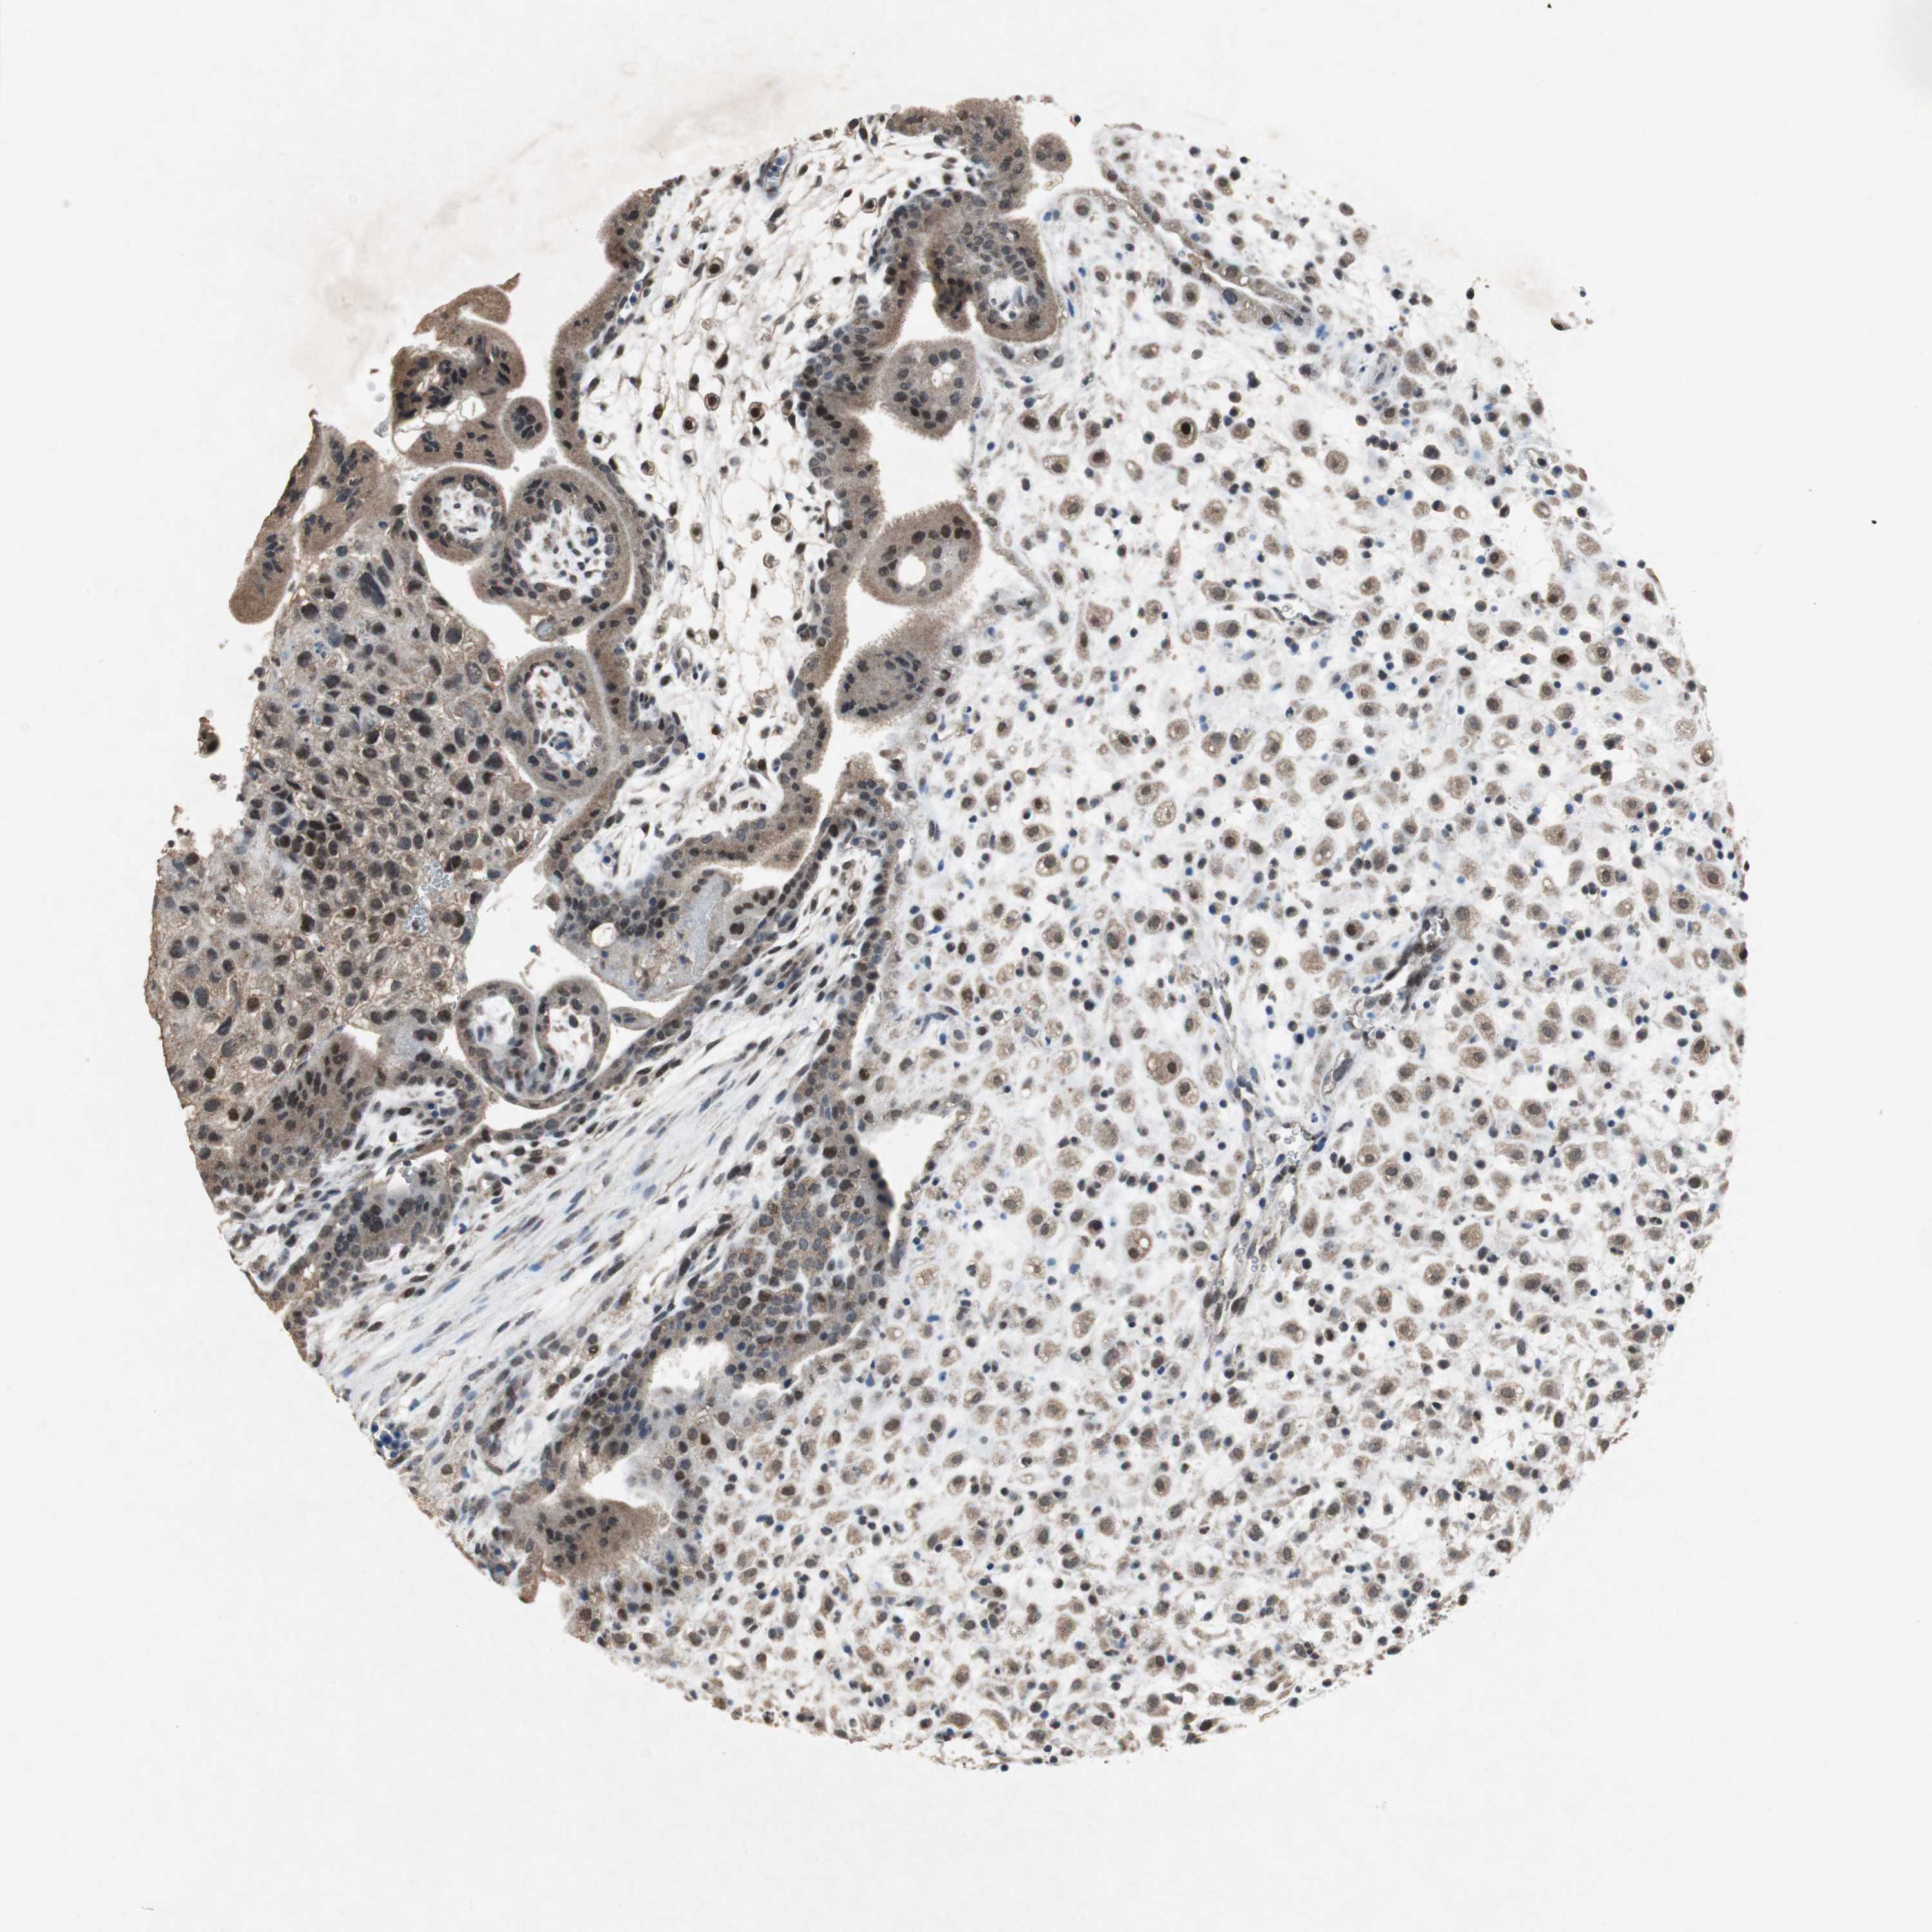
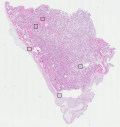
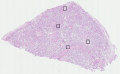
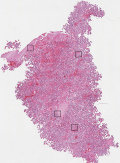
PLACENTA
GENE/PROTEIN
|
|
||||||||||||||||||||||||||||||||||||||||||||||||||||||||||||||||||||||||||||||||||||||||||||||||||||||||||||||||||||||||||||||||||||||||||||||||||||||||
The Project
The Human Protein Atlas


 Female, age N/A
  Female, age 28
 Female, age 39
 Female, age 31
 Female, age 30
 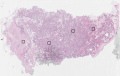 Female, age 31
 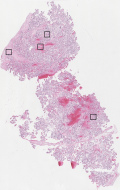 Female, age 37
 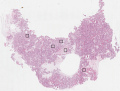 Female, age 36


