The bone marrow-specific proteome
|
Bone marrow is the tissue in the interior cavities of bones, constituting approximately 4% of the total body mass of humans. The red marrow, which constitutes the hematopoietic component of bone marrow, is responsible for producing hematopoietic cells of all lineages, which subsequently use the bone marrow vasculature as a conduit to the body's systemic circulation. The bone marrow samples used in this study are Ficoll separated preparations, in which the non-hematopoietic components of stroma, adipose cells, bone and vessels as well as large portions of the fully differentiated erythropoietic and myelopoietic populations have been removed. The transcriptome analysis shows that 58% of all human proteins (n=19628) are expressed in the bone marrow and 300 of these genes show an elevated expression in bone marrow compared to other tissue types.
An analysis of the genes with elevated expression in bone marrow, with regards to function, reveals that they are dominantly involved in immune response and leukocyte migration.
|
- 70 bone marrow enriched genes
- Most of the enriched genes encode proteins involved in defense against other organisms
- 300 genes defined as elevated in bone marrow
- Most of the elevated genes in lymph node encode proteins that are involved in immune response and leukocyte migration
- 46 genes defined as group-enriched in bone marrow
- Most group-enriched genes are shared with testis
|
Figure 1. The distribution of all genes across the five categories based on transcript abundance in bone marrow as well as in all other tissues.
300 genes show some level of elevated expression in the bone marrow compared to other tissues. The three categories of genes with elevated expression in bone marrow compared to other organs are shown in Table 1. The overall function of proteins corresponding to tissue enriched genes (n=70) is well in line with the function of the bone marrow.
Table 1. The genes with elevated expression in bone marrow
Category |
Number of genes |
Description |
| Tissue enriched |
70 |
At least five-fold higher mRNA levels in a particular tissue as compared to all other tissues |
| Group enriched |
46 |
At least five-fold higher mRNA levels in a group of 2-7 tissues |
| Tissue enhanced |
184 |
At least five-fold higher mRNA levels in a particular tissue as compared to average levels in all tissues |
| Total |
300 |
Total number of elevated genes in bone marrow |
Table 2. The 12 genes with the highest level of enriched expression in bone marrow. "Predicted localization" shows the classification of each gene into three main classes: Secreted, Membrane, and Intracellular, where the latter consists of genes without any predicted membrane and secreted features. "mRNA (tissue)" shows the transcript level as TPM values, TS-score (Tissue Specificity score) corresponds to the score calculated as the fold change to the second highest tissue.
Gene |
Description |
Predicted localization |
mRNA (tissue) |
TS-score |
| PRTN3 |
proteinase 3 |
Intracellular,Secreted |
617.7 |
716 |
| DEFA4 |
defensin, alpha 4, corticostatin |
Secreted |
3114.1 |
633 |
| AZU1 |
azurocidin 1 |
Intracellular,Secreted |
1314.1 |
528 |
| DEFA1B |
defensin, alpha 1B |
Secreted |
61211.3 |
514 |
| ELANE |
elastase, neutrophil expressed |
Secreted |
1202.2 |
320 |
| RNASE3 |
ribonuclease, RNase A family, 3 |
Secreted |
573.6 |
300 |
| DEFA1 |
defensin, alpha 1 |
Secreted |
15680.7 |
284 |
| MS4A3 |
membrane-spanning 4-domains, subfamily A, member 3 (hematopoietic cell-specific) |
Membrane,Secreted |
305.8 |
254 |
| DEFA3 |
defensin, alpha 3, neutrophil-specific |
Secreted |
23349.1 |
189 |
| PRSS57 |
protease, serine, 57 |
Secreted |
103.6 |
170 |
| MMP8 |
matrix metallopeptidase 8 |
Intracellular,Secreted |
336.3 |
103 |
| CEACAM8 |
carcinoembryonic antigen-related cell adhesion molecule 8 |
Intracellular,Secreted |
150.9 |
88 |
Some of the proteins predicted to be membrane-spanning are intracellular, e.g. in the Golgi or mitochondrial membranes, and some of the proteins predicted to be secreted can potentially be retained in a compartment belonging to the secretory pathway, such as the ER, or remain attached to the outer face of the cell membrane by a GPI anchor.
The bone marrow transcriptome
An analysis of the expression levels of each gene makes it possible to calculate the relative mRNA pool for each of the categories. The analysis shows that 57% of the mRNA molecules in the bone marrow correspond to housekeeping genes and 39% of the mRNA pool corresponds to genes categorized to be either bone marrow enriched, group enriched, or enhanced. Thus, most of the transcriptional activity in the bone marrow relates to proteins with presumed housekeeping functions as they are found in all tissues and cells analyzed. In addition, it is evident that the genes with an elevated expression (n=300) in bone marrow are transcribed at very high levels, as these genes constitute 1.5% of all genes and generate 39% of the total pool of transcripts.
Protein expression of genes elevated in bone marrow
The list of elevated genes (n=300) are well in line with the function of the bone marrow, as it includes an overrepresentation of proteins associated immune response and leukocyte migration, and the nine genes with the highest expression in bone marrow encode proteins with known functions in neutrophils (DEFA1, DEFA1B, DEFA3, DEFA4, CTSG and MPO) and erythrocytes (HBB, HBA1 and HBA2; all hemoglobin proteins). Both neutrophils and erythrocytes reach maturity in bone marrow and are released into the blood stream as effector cells, equipped with necessary proteins for their specialized functions. Consequently, a high level of transcription of these genes takes place in bone marrow, explaining the high TPM-values seen in Table 2.
Proteins specifically expressed in granulocytes
Besides erythropoietic cells and platelets, polymorphonuclear leukocytes cells, and in particular cells of neutrophil lineage, make up the majority of hematopoietic cells in bone marrow. S100A12, a calcium-binding pro inflammatory protein predominantly secreted by granulocytes, shows a tissue enriched expression in bone marrow, and immunohistochemistry displays a strong and distinct positivity in bone marrow and spleen.
Genes CTSG and DEFA4 are two of the genes with the highest expression in bone marrow, and known to be expressed in neutrophils and involved in the defense against bacteria. Protein profiles for CTSG and DEFA4 show strong staining of granulocytes.
Proteins specifically expressed in mast cells and macrophages
The granulocytic mast cells and the agranulocytic macrophages are present in lower numbers than neutrophils in bone marrow. MCEMP1, a fairly uncharacterized gene found to encode a single-pass transmembrane protein expressed in human mast cell (Li, K. et al, 2005), displays a group enriched expression in bone marrow, along with lung and appendix. The RNA-seq data is supported by immunohistochemistry, with positivity in substes of cells in bone marrow and appendix and also in alveolar macrophages in the lung.
Genes shared between bone marrow and other tissues
There are 46 group enriched genes expressed in the bone marrow. Group enriched genes are defined as genes showing a 5-fold higher average level of mRNA expression in a group of 2-7 tissues, including bone marrow, compared to all other tissues.
In order to illustrate the relation of bone marrow tissue to other tissue types, a network plot was generated, displaying the number of commonly expressed genes between different tissue types. The network plot shows that most genes are shared with testis.
Figure 2. An interactive network plot of the bone marrow enriched and group enriched genes connected to their respective enriched tissues (grey circles). Red nodes represent the number of bone marrow enriched genes and orange nodes represent the number of genes that are group enriched. The sizes of the red and orange nodes are related to the number of genes displayed within the node. Each node is clickable and results in a list of all enriched genes connected to the highlighted edges. The network is limited to group enriched genes in combinations of up to 5 tissues, but the resulting lists show the complete set of group enriched genes in the particular tissue.
Among the enriched genes in bone marrow, we found two genes also displaying an enriched expression in testis, HEMGN (Hemogen) and SPATC1 (Spermatogenesis and centriole associated 1). Hemogen is fairly well characterized, and appears to be involved in hematopoietic differentiation. However, an mRNA isoform different from that found in hematopoietic cells has been identified in round spermatids of testis (Yang, LV. et al, 2003). Immunohistochemical staining of Hemogen is in concordance with the RNA-seq data and literature, showing strong staining in a subset of cells in bone marrow and spermatids in testis.
Spermatogenesis and centriole associated 1 is an unknown protein,although the SPATC1 protein has been detected in sperms where it surrounds the intact proximal centriole (Goto, M., 2010). Immunohistochemistry displays a cytoplasmic staining in bone marrow and testis, mostly pronounced in spermatogonia, which is supported by RNA-seq data
Bone marrow function
Bone marrow is either red or yellow, depending on the preponderance of hematopoietic (red) or fatty (yellow) tissue. Red marrow consists of a highly vascularized stromal network containing pluripotent and committed stem cells of all hematopoietic lineages, i.e. erythrocytic, leukocytic and platelets. While erythrocytes and leukocytes develop from stages of precursors, platelets, small blood cell fragments involved in clotting, form from giant marrow cells called megakaryocytes.
At birth and until about the age of seven, all human marrow is red, as the need for new blood formation is high. Fat tissue gradually replaces the red marrow, which in adults is mainly found in flat bones, such as the vertebrae, ilium, sternum and cranium as well as at the epiphyseal ends of the long bones of the arm and leg.
The main functions of the bone marrow can be categorized in three groups: production of erythrocytes, production of platelets, and production of leukocytes.
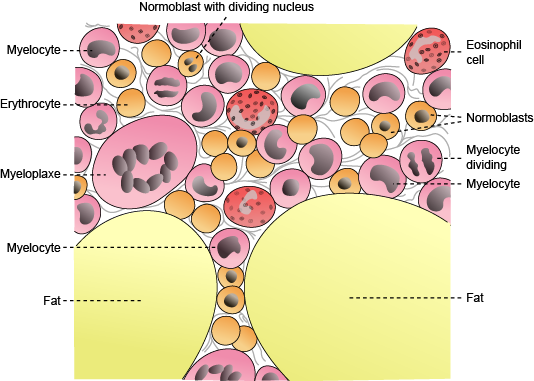
Figure 3. Schematic view of bone marrow tissue. Attribution: By Mysid [Public domain], via Wikimedia Commons. Source
The histology of human bone marrow including detailed images and information can be viewed in the Protein Atlas Histology Dictionary.
Background
Here, the protein-coding genes expressed in the bone marrow are described and characterized, together with examples of immunohistochemically stained tissue sections that visualize protein expression patterns of proteins that correspond to genes with elevated expression in the bone marrow.
Transcript profiling and RNA-data analyses based on normal human tissues have been described previously (Fagerberg et al., 2013). Analyses of mRNA expression including over 99% of all human protein-coding genes was performed using deep RNA sequencing of 172 individual samples corresponding to 37 different human normal tissue types. RNA sequencing results of 4 fresh frozen tissues representing normal bone marrow was compared to 168 other tissue samples corresponding to 36 tissue types, in order to determine genes with elevated expression in bone marrow. A tissue-specific score, defined as the ratio between mRNA levels in bone marrow compared to the mRNA levels in all other tissues, was used to divide the genes into different categories of expression.
These categories include: genes with elevated expression in bone marrow, genes expressed in all tissues, genes with a mixed expression pattern, genes not expressed in bone marrow, and genes not expressed in any tissue. Genes with elevated expression in bone marrow were further sub-categorized as i) genes with enriched expression in bone marrow, ii) genes with group enriched expression including bone marrow and iii) genes with enhanced expression in bone marrow.
Human tissue samples used for protein and mRNA expression analyses were collected and handled in accordance with Swedish laws and regulation and obtained from the Department of Pathology, Uppsala University Hospital, Uppsala, Sweden as part of the sample collection governed by the Uppsala Biobank. All human tissue samples used in the present study were anonymized in accordance with approval and advisory report from the Uppsala Ethical Review Board.
Relevant links and publications
Uhlén M et al, 2015. Tissue-based map of the human proteome. Science
PubMed: 25613900 DOI: 10.1126/science.1260419 Yu NY et al, 2015. Complementing tissue characterization by integrating transcriptome profiling from the Human Protein Atlas and from the FANTOM5 consortium. Nucleic Acids Res.
PubMed: 26117540 DOI: 10.1093/nar/gkv608 Fagerberg L et al, 2014. Analysis of the human tissue-specific expression by genome-wide integration of transcriptomics and antibody-based proteomics. Mol Cell Proteomics.
PubMed: 24309898 DOI: 10.1074/mcp.M113.035600 Andersson S et al, 2014. The transcriptomic and proteomic landscapes of bone marrow and secondary lymphoid tissues. PLoS One.
PubMed: 25541736 DOI: 10.1371/journal.pone.0115911 Histology dictionary - bone marrow
|