The brain-specific proteome
|
The function of the brain, defined as the central nervous system, is to receive, process and execute the coordinated higher functions of perception, motion and cognition that signify human life. The brain can grossly be divided into different neuroanatomical functional regions such as the frontal, parietal, temporal, occipital lobes and central gray matter structures. The brain can further be stratified into neuron rich grey matter and myelinated white matter. The cellular components of the underlying and highly complex network of transmitted signals include neurons and supportive glial cells. The transcriptome analysis shows that 74% of all human proteins (n=19628) are expressed in the brain and 1437 of these genes show an elevated expression in brain compared to other tissue types.
An analysis of the genes with elevated expression in the brain show various patterns of expression in different neurons and glial cells, as well as in neuropil; the meshwork of axons, dendrites, synapses and extra cellular matrix that embed the central nervous system cells.
|
- 415 brain enriched genes
- Most of the enriched genes encode proteins involved in transport and signaling
- 1437 genes defined as elevated in the brain
- Most group enriched genes shared with testis
|
Figure 1. The distribution of all genes across the five categories based on transcript abundance in brain as well as in all other tissues.
1437 genes show some level of elevated expression in the brain compared to other tissues. The three categories of genes with elevated expression in brain compared to other organs are shown in Table 1. The list of tissue enriched genes (n=415) are well in-line with the function of the brain.
Table 1. The genes with elevated expression in brain
Category |
Number of genes |
Description |
| Tissue enriched |
415 |
At least five-fold higher mRNA levels in a particular tissue as compared to all other tissues |
| Group enriched |
239 |
At least five-fold higher mRNA levels in a group of 2-7 tissues |
| Tissue enhanced |
783 |
At least five-fold higher mRNA levels in a particular tissue as compared to average levels in all tissues |
| Total |
1437 |
Total number of elevated genes in brain |
Table 2. The 12 genes with the highest level of enriched expression in brain. "Predicted localization" shows the classification of each gene into three main classes: Secreted, Membrane, and Intracellular, where the latter consists of genes without any predicted membrane and secreted features. "mRNA (tissue)" shows the transcript level as TPM values, TS-score (Tissue Specificity score) corresponds to the score calculated as the fold change to the second highest tissue.
Gene |
Description |
Predicted localization |
mRNA (tissue) |
TS-score |
| OPALIN |
oligodendrocytic myelin paranodal and inner loop protein |
Intracellular,Membrane |
86.6 |
866 |
| GFAP |
glial fibrillary acidic protein |
Intracellular |
4111.0 |
431 |
| OMG |
oligodendrocyte myelin glycoprotein |
Secreted |
137.8 |
318 |
| OLIG2 |
oligodendrocyte lineage transcription factor 2 |
Intracellular |
91.2 |
239 |
| NEUROD6 |
neuronal differentiation 6 |
Intracellular |
22.4 |
225 |
| GRIN1 |
glutamate receptor, ionotropic, N-methyl D-aspartate 1 |
Membrane |
152.3 |
202 |
| SLC17A7 |
solute carrier family 17 (vesicular glutamate transporter), member 7 |
Membrane |
586.2 |
178 |
| CREG2 |
cellular repressor of E1A-stimulated genes 2 |
Secreted |
91.2 |
159 |
| NEUROD2 |
neuronal differentiation 2 |
Intracellular |
14.9 |
146 |
| C1orf61 |
chromosome 1 open reading frame 61 |
Intracellular |
505.2 |
131 |
| KCNJ9 |
potassium channel, inwardly rectifying subfamily J, member 9 |
Membrane |
52.5 |
112 |
| OLIG1 |
oligodendrocyte transcription factor 1 |
Intracellular |
143.0 |
103 |
Some of the proteins predicted to be membrane-spanning are intracellular, e.g. in the Golgi or mitochondrial membranes, and some of the proteins predicted to be secreted can potentially be retained in a compartment belonging to the secretory pathway, such as the ER, or remain attached to the outer face of the cell membrane by a GPI anchor.
The brain transcriptome
An analysis of the expression levels of each gene makes it possible to calculate the relative mRNA pool for each of the categories. The analysis shows that 79% of the mRNA molecules in the brain correspond to housekeeping genes and only 13% of the mRNA pool corresponds to genes categorized to be either brain enriched, group enriched, or enhanced. Thus, most of the transcriptional activity in the brain relates to proteins with presumed housekeeping functions as they are found in all tissues and cells analyzed.
A Gene Ontology analysis using all genes expressed in the frontal cortex as background expression was performed. The majority of enriched processes are linked to various aspects of synaptic signaling or neurological processes driven by synaptic transmission. In addition we identified a cluster of brain-enriched developmental processes of which many specific for development of the nervous system. A cellular component analysis using GOSlim tools revealed an enrichment protein located in the cell membranes and extracellular proteins compared to all known proteins. This indicates that specialized brain proteins are often membranous/membrane bound and extracellular proteins involved in synaptic functions and developmental processes.
Protein expression of genes elevated in brain
In-depth analysis of the elevated genes in brain using antibody-based protein profiling allowed us to understand the distribution of the brain specific genes and their expression profiles. A majority of the protein profiles are associated with neuropil and potentially liked to transport and communication between cells. The synaptic interface and connections seems to involve a large number of the brain specific genes.
Proteins specifically expressed in neurons
Neurons are functional entities in the brain and based on morphology and neurotransmitter phenotype originally divided into two main classes, excitatory, glutamatergic pyramidal projection neurons (~75%) and inhibitory, mostly GABAergic interneurons (~25%). The protein ELAV-like protein 3 (ELAVL3) is expressed in all neurons, neurogranin (NRGN) is strongly expressed in all pyramidal neurons whereas receptor expression enhancing protein 2 (REEP2, a protein with yet unknown cortical function(s)), can only be detected in a subset of mainly pyramidal neurons. On the other hand, glutamate decarboxylase 1 (GAD1) is an essential enzyme in the biosynthesis of GABA and known to be expressed in the majority of cortical GABAergic interneurons. Protocadherin alpha-1 (PCDHA1) is expressed in cerebral cortex and testis at low levels. In agreement, this calcium-dependent cell adhesion molecule can be detected in a few sparsely distributed interneuron-like neurons in the human cortex. These data show a relationship between TPM values and the number of cells expressing proteins distributed in the neuronal perikarya.
Detailed immunohistochemical analysis of proteins with known molecular functions shows that many brain-enriched proteins are involved in transport of neurotransmitters in synaptic vesicles (e.g. vesicular glutamate transporter 2 (SLC17A6), docking of synaptic vesicles (e.g. synaptophysin (SYP)) and release of neurotransmitters (e.g. Ras-related protein RAB3A) from the presynaptic nerve terminal. Also various known post-synaptic proteins including the GABA B receptor subunit 2 (GABBR2) and proteins involved in clearing of neurotransmitters from the synaptic cleft like the solute carrier family 1, member 2 (SLC1A2) as well as proteins involved in organizing and maintaining synaptic connections, such as cell adhesion molecule 2 (CADM2) are encountered. These data underline that events associated with synaptic transmission require specialized proteins, which are not expressed in other organs and tissues lacking the exocytosis process.
Proteins specifically expressed in glial cells
Glial cells constitute the most abundant class of cells in the brain and can generally be subdivided into astrocytes, oligodendrocytes and microglia based on morphology and function.
The majority of glial cells in our analysis have an astrocyte-like staining pattern present in both grey and white matter structures.
However, variation in distribution, morphology and cell density is observed. The well-known astrocyte markers
GFAP and S100B and the unexplored gene FAM19A1
with sequence similarity to chemokines are expressed in astrocyte-like cells in both the white and grey matter. In contrast the
water transporter AQP4 is mainly expressed in the grey matter and reveals a neuropil-like staining
pattern due to the localization of the protein in numerous glia endfeet. The uncharacterized lectin like protein (C-type lectin
domain family 2, member L, CLEC2L) is mainly localized in astrocyte-like cells in the white matter. These
data indicate the various specialized functions of astrocytes in the central nervous system and may open up possibilities to
identify subclasses of glia, not only on the basis of morphology and location, but also on gene expression.
Several genes expressed in oligodendrocytes are involved in myelination, such as the compact myelin proteins myelin basic protein (MBP) and proteolipid protein 1 (PLP1). In contrast to the oligodendrocyte transcription factor OLIG2, none of the other investigated myelin sheet components are brain specific. MBP and PLP1 are enriched but this is mainly due to the sample composition containing 25% densely myelinated white matter. TPM values >10 are found in several other tissue types. Immunohistochemical analysis reveals that this expression mainly represents Schwann cells in peripheral nerves.
The third type of glial cells 'populating' the brain is microglia. These cells are derived from hematopoietic stem cells
invading the brain during embryonic development or macrophages that enter the brain from the bloodstream later in life.
The well-known microglia genes integrin alpha M chain (ITGAM) and allograft inflammatory factor 1
(AIF1) are not specific nor enriched in the brain but are also expressed, for example, in cells
populating the lymph node and bone marrow, the main site of hematopoiesis. Based on our immubohistochemistry analysis we can only
identify one microglia gene, purinoceptor P2RY12, enhanced in brain tissue, with low expression in lymph
node and bone marrow. These data show the close relationship of microglia and hematopoietic cells reflecting the common
developmental origin of microglia and macrophages.
Genes shared between brain and other tissues
There are 239 group enriched genes expressed in the brain. Group enriched genes are defined as genes showing a 5-fold higher average level of mRNA expression in a group of 2-7 tissues, including brain, compared to all other tissues.
In order to illustrate the relation of brain tissue to other tissue types, a network plot was generated, displaying the
number of commonly expressed genes between different tissue types. The common origin of neuroectoderm is a plausible reason
for the relatively high number of genes connecting brain with adrenal gland and pancreas. However, a clear connection for
the large number of genes shared between testis and brain could not be revealed, neither by gene ontology analysis or
immunohistochemical analysis and further investigations are needed. The network plot reveals that most group enriched genes are shared with the testis (n=45).
Figure 2. An interactive network plot of the cerebral cortex enriched and group enriched genes connected to their respective enriched tissues (grey circles). Red nodes represent the number of cerebral cortex enriched genes and orange nodes represent the number of genes that are group enriched. The sizes of the red and orange nodes are related to the number of genes displayed within the node. Each node is clickable and results in a list of all enriched genes connected to the highlighted edges. The network is limited to group enriched genes in combinations of up to 2 tissues, but the resulting lists show the complete set of group enriched genes in the particular tissue.
SH3GL3 is implicated in neuronal endocytosis, and group enriched in cerebral cortex and testis. Immunohistochemical analysis shows the encoded protein to be expressed in sperm cells and neuropil.
AQP4, is also group enriched and show highest TPM value in cerebral cortex and lung.
Brain function and histology
The nervous system represents the major communication network and consists of the central nervous system (CNS) and
peripheral nervous system (PNS). The intracranial cerebrum and cerebellum together with the spinal cord constitutes the CNS.
The brain is covered by layers of membranes, the meninges, and submerged in cerebrospinal fluid, which also fills the
intracerebral ventricles. The brain can grossly be divided into different neuroanatomical functional regions such as the
frontal, parietal, temporal, occipital lobes and central gray matter structures. Anatomically and histologically the brain
can further be stratified into the cerebral cortex representing the outermost gray matter
overlying white matterand the innermost deep gray matter components. The hippocampus,
containing the neuron rich dentate fascia, is closely associated with the cerebral cortex, and
is located 20in the medial temporal lobe. The cerebral cortex incorporates neurons (nerve cells)
and glial cells (supportive cells), whereas the white matter incorporates primarily oligodendrocytes and axons
from cortical and subcortical projection neurons.
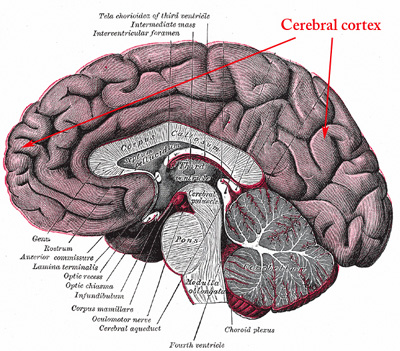
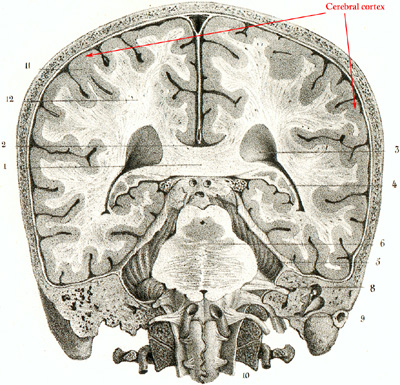
Figure 3. Schematic image of a normal human brain that visualizes brain structures in a sagittal plane, showing the right half of the brain (upper), and in a frontal plane, showing the posterior half of the brain (lower). The cerebral cortex represents the outer layers of the brain and consists of neuron-rich grey matter.
The brain is composed of neurons embedded in a framework of glial cells (astrocytes and oligodendrocytes) as well as microglia and blood vessels. In addition to the cell bodies that can be defined in the microscope, cell processes from neurons and glial cells form a synaptically rich "background substance" often referred to as neuropil.
The neurons are a morphologically and functionally heterogeneous family of cells that can transmit information through chemical and electrical signaling. Neurons vary in size from the small round cells that populate the internal granular layer of the cerebellum to the large pyramidal neurons of the primary motor cortex and the Purkinje cells of the cerebellum. Astrocytes represent the major glial cell type in the brain and are characterized by their cellular cytoplasmic processes reaching both synapses and capillary walls. The astrocyte is a star shaped cell involved in the maintenance of the microenvironment surrounding neurons and also important for the blood-brain barrier function. Oligodendrocytes are the main producer of myelin and are characterized by their small, rounded and lymphocyte like nuclei.
The histology of human brain including detailed images and information about the different cell types can be viewed in the Protein Atlas Histology Dictionary.
Background
Here, the protein-coding genes expressed in the cerebral cortex are described and characterized, together with examples of immunohistochemically stained tissue sections that visualize protein expression patterns of proteins that correspond to genes with elevated expression in the cerebral cortex.
Transcript profiling and RNA-data analyses based on normal human tissues have been described previously (Fagerberg et al., 2013). Analyses of mRNA expression including over 99% of all human protein-coding genes was performed using deep RNA sequencing of 172 individual samples corresponding to 37 different human normal tissue types. RNA sequencing results of 3 fresh frozen tissues representing normal cerebral cortex was compared to 169 other tissue samples corresponding to 36 tissue types, in order to determine genes with elevated expression in cerebral cortex. A tissue-specific score, defined as the ratio between mRNA levels in cerebral cortex compared to the mRNA levels in all other tissues, was used to divide the genes into different categories of expression.
These categories include: genes with elevated expression in cerebral cortex, genes expressed in all tissues, genes with a mixed expression pattern, genes not expressed in cerebral cortex, and genes not expressed in any tissue. Genes with elevated expression in cerebral cortex were further sub-categorized as i) genes with enriched expression in cerebral cortex, ii) genes with group enriched expression including cerebral cortex and iii) genes with enhanced expression in cerebral cortex.
Human tissue samples used for protein and mRNA expression analyses were collected and handled in accordance with Swedish laws and regulation and obtained from the Department of Pathology, Uppsala University Hospital, Uppsala, Sweden as part of the sample collection governed by the Uppsala Biobank. All human tissue samples used in the present study were anonymized in accordance with approval and advisory report from the Uppsala Ethical Review Board.
Relevant links and publications
Uhlén M et al, 2015. Tissue-based map of the human proteome. Science
PubMed: 25613900 DOI: 10.1126/science.1260419 Yu NY et al, 2015. Complementing tissue characterization by integrating transcriptome profiling from the Human Protein Atlas and from the FANTOM5 consortium. Nucleic Acids Res.
PubMed: 26117540 DOI: 10.1093/nar/gkv608 Fagerberg L et al, 2014. Analysis of the human tissue-specific expression by genome-wide integration of transcriptomics and antibody-based proteomics. Mol Cell Proteomics.
PubMed: 24309898 DOI: 10.1074/mcp.M113.035600 Sjöstedt E et al, 2015. Defining the Human Brain Proteome Using Transcriptomics and Antibody-Based Profiling with a Focus on the Cerebral Cortex. PLoS One.
PubMed: 26076492 DOI: 10.1371/journal.pone.0130028
An anatomically comprehensive atlas of the adult human brain transcriptome
Allen brain atlas
Histology dictionary - the brain
|