- THE HUMAN PROTEOME
- THE HUMAN TISSUES
- THE HUMAN CELL
- PROTEIN CLASSES
- PROTEIN EVIDENCE
- NEWS
- BLOG
- EVENTS
- PRESS ROOM
- LEARN
- DICTIONARY
- METHODS
- CELL LINES
|
TISSUE ATLAS
PRIMARY DATA
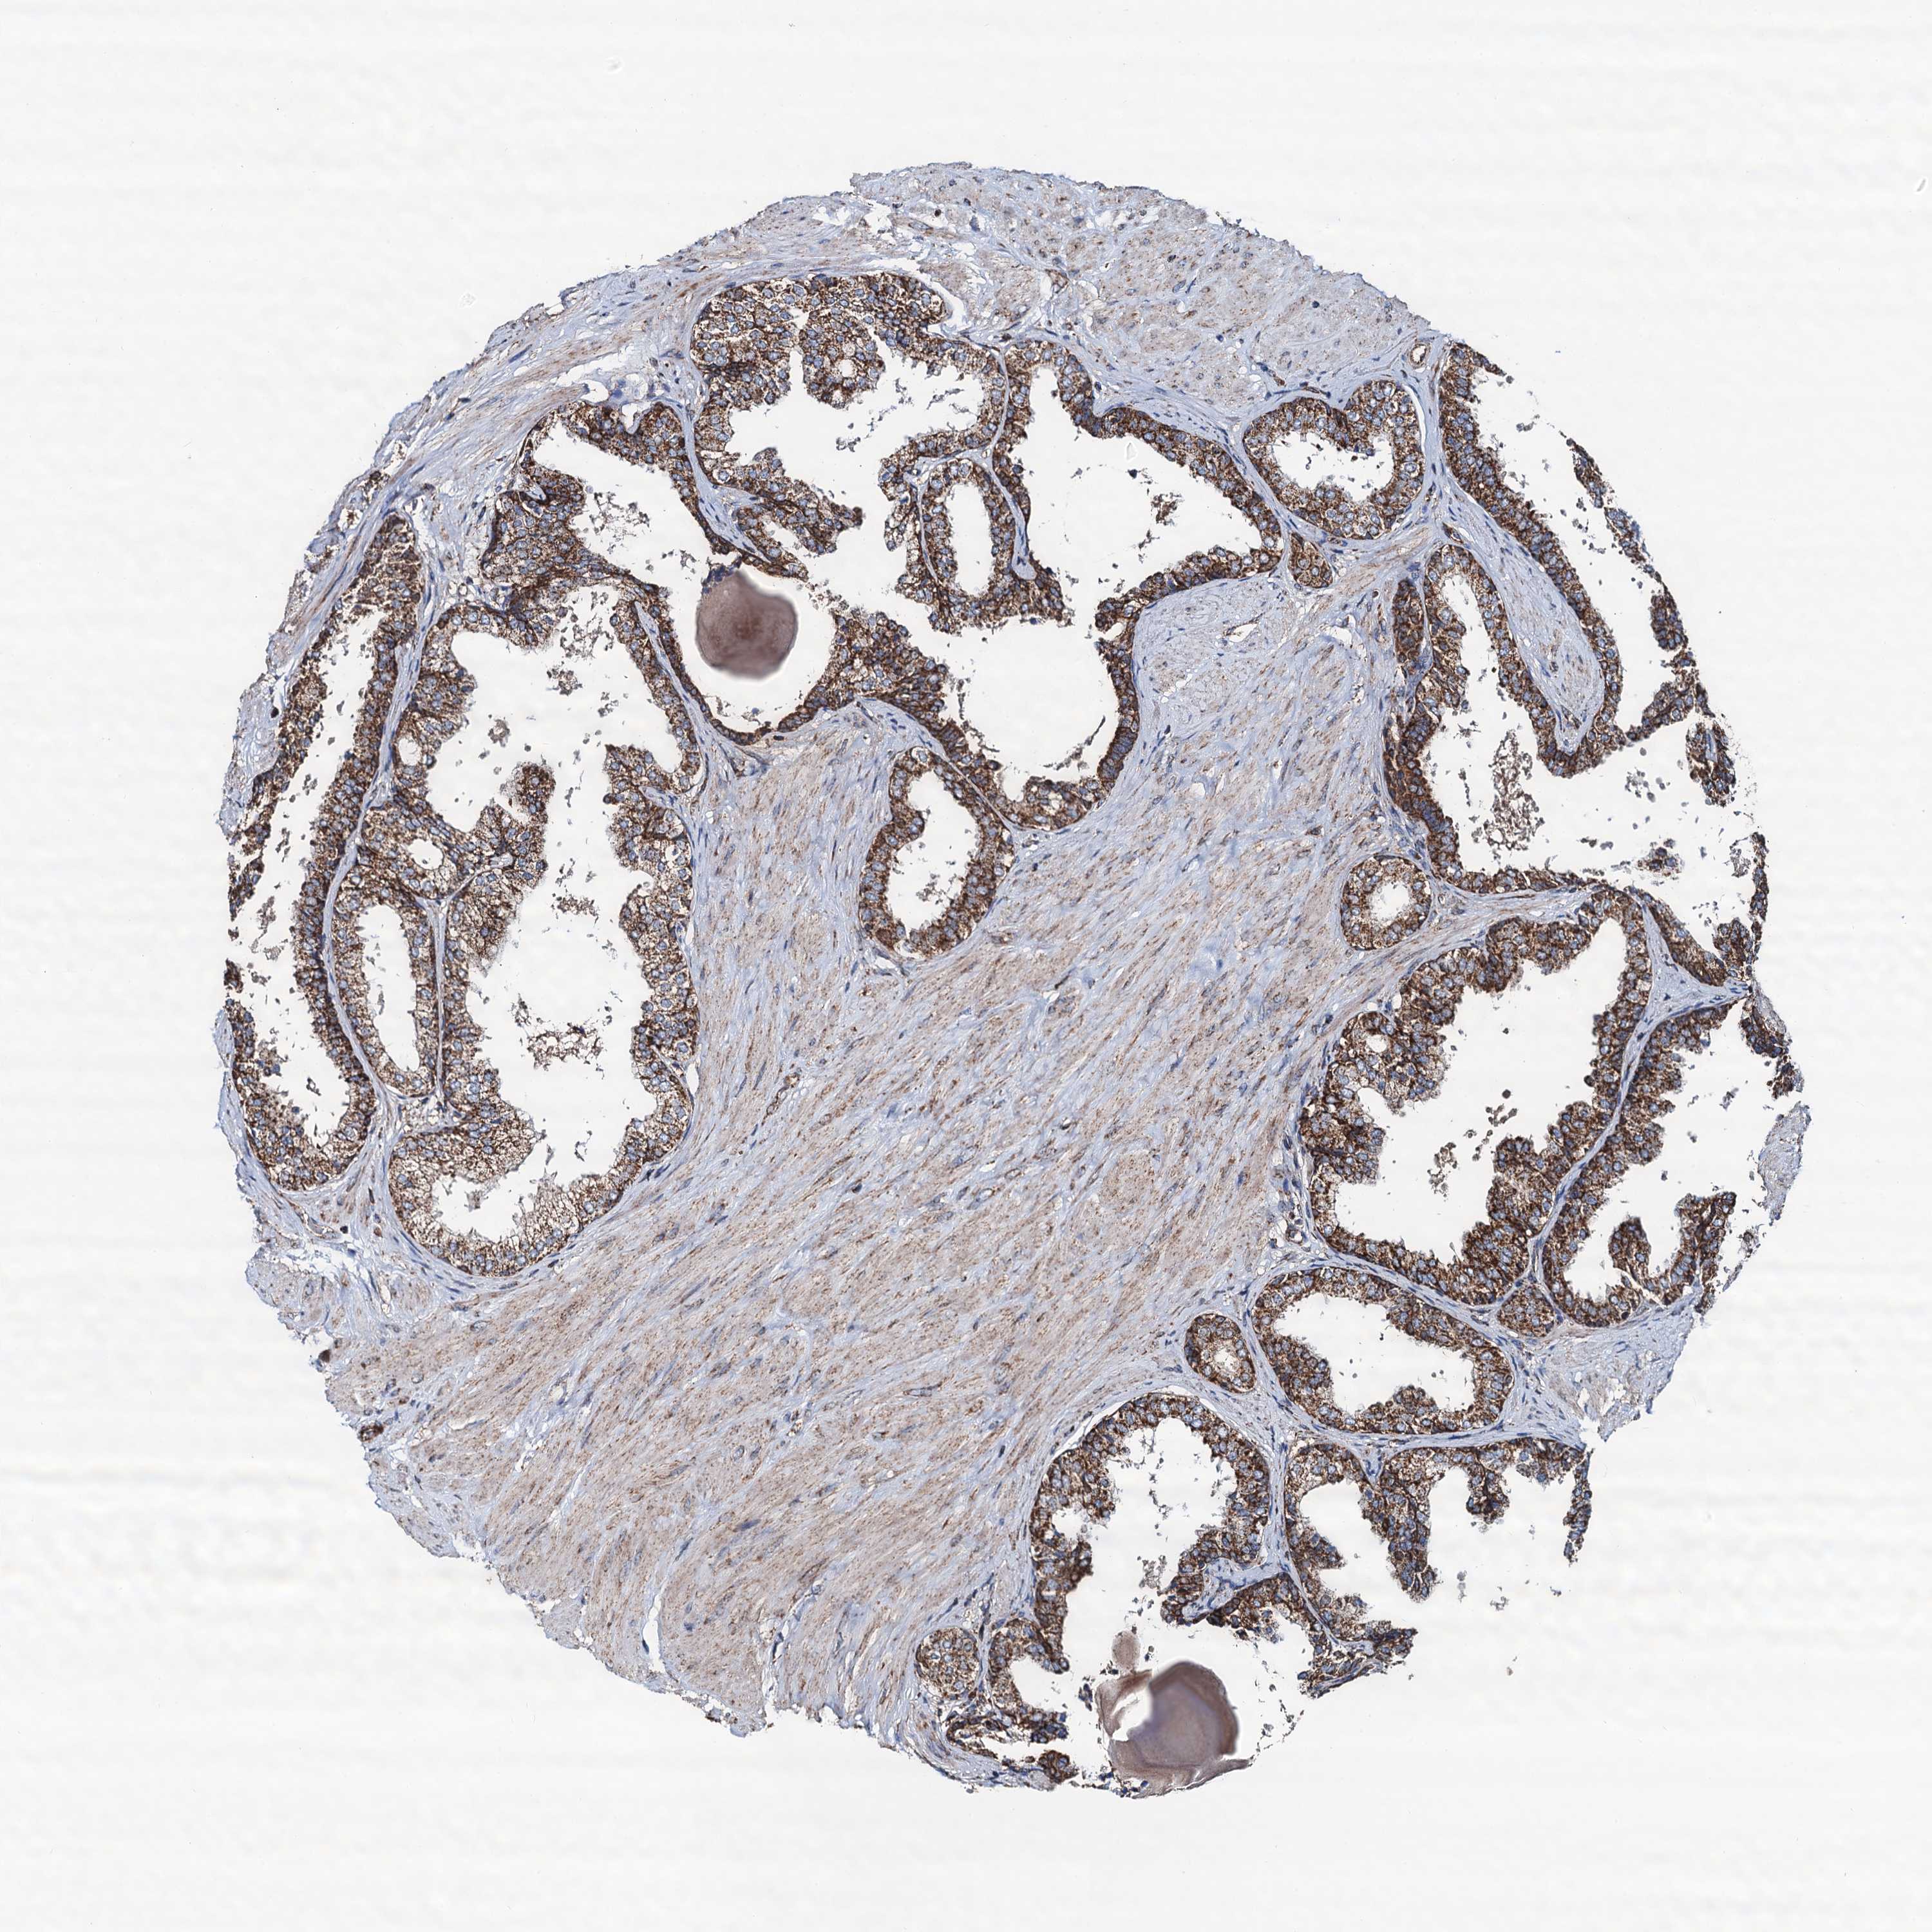
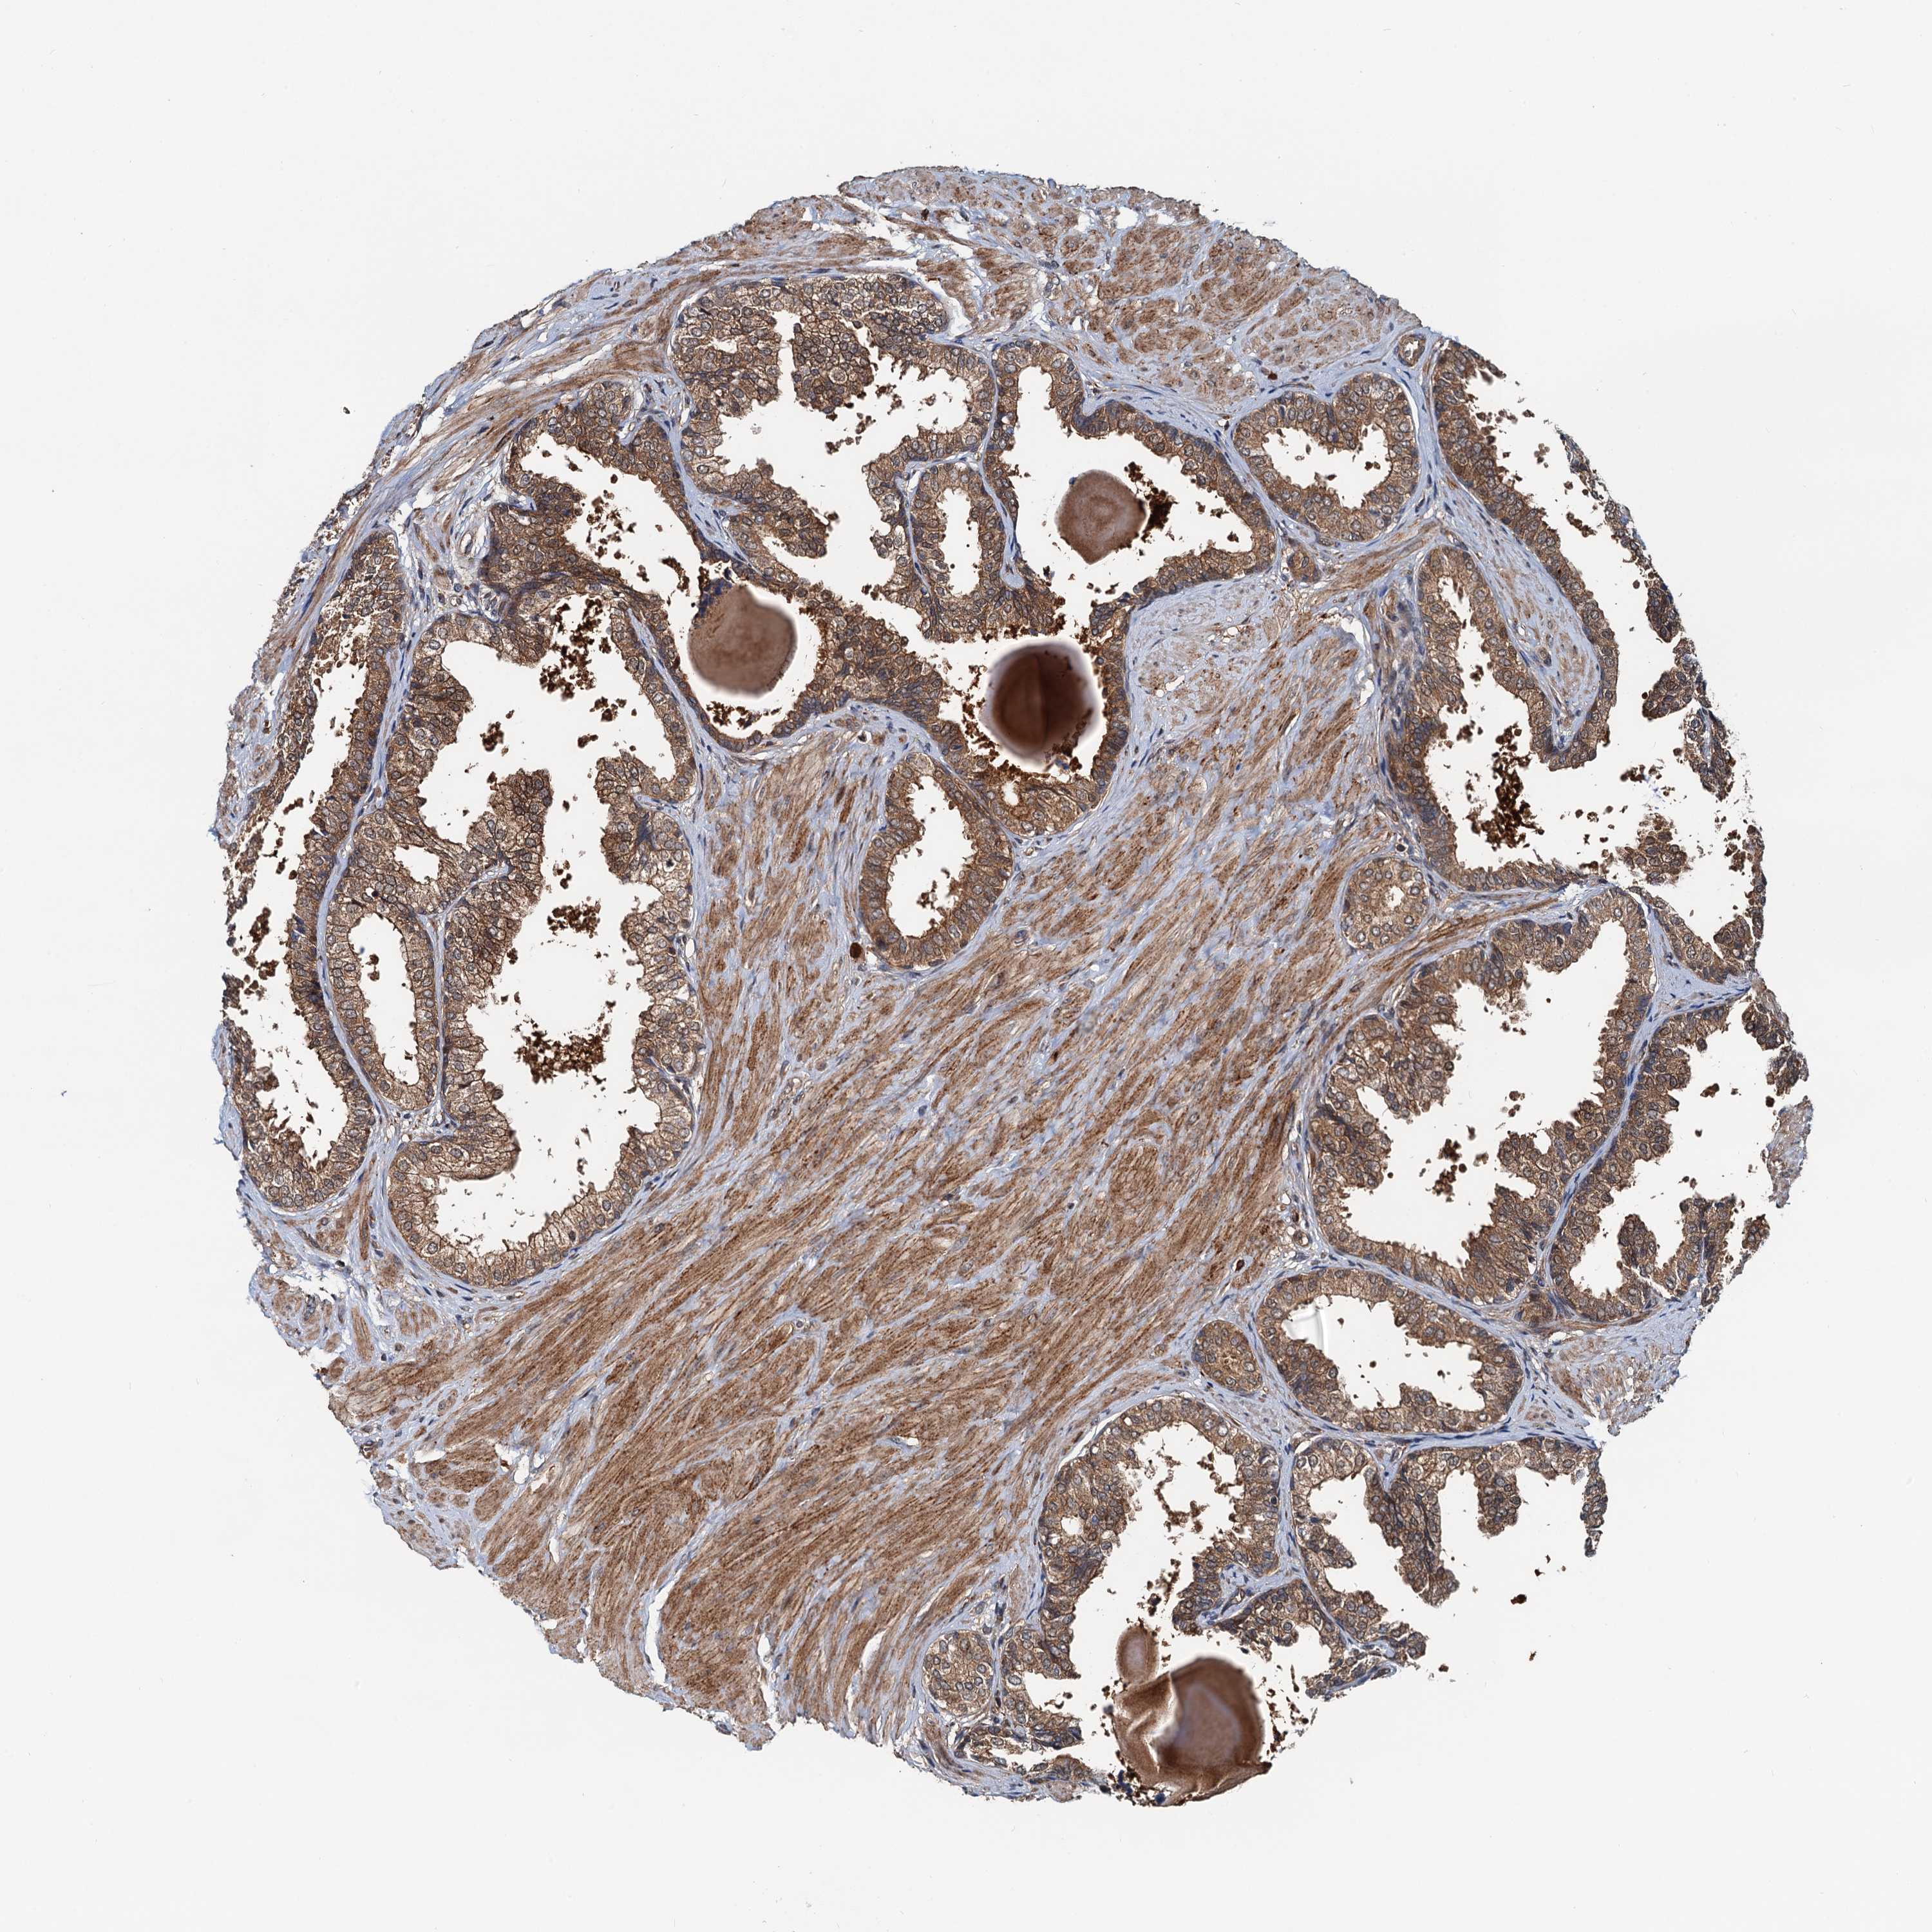
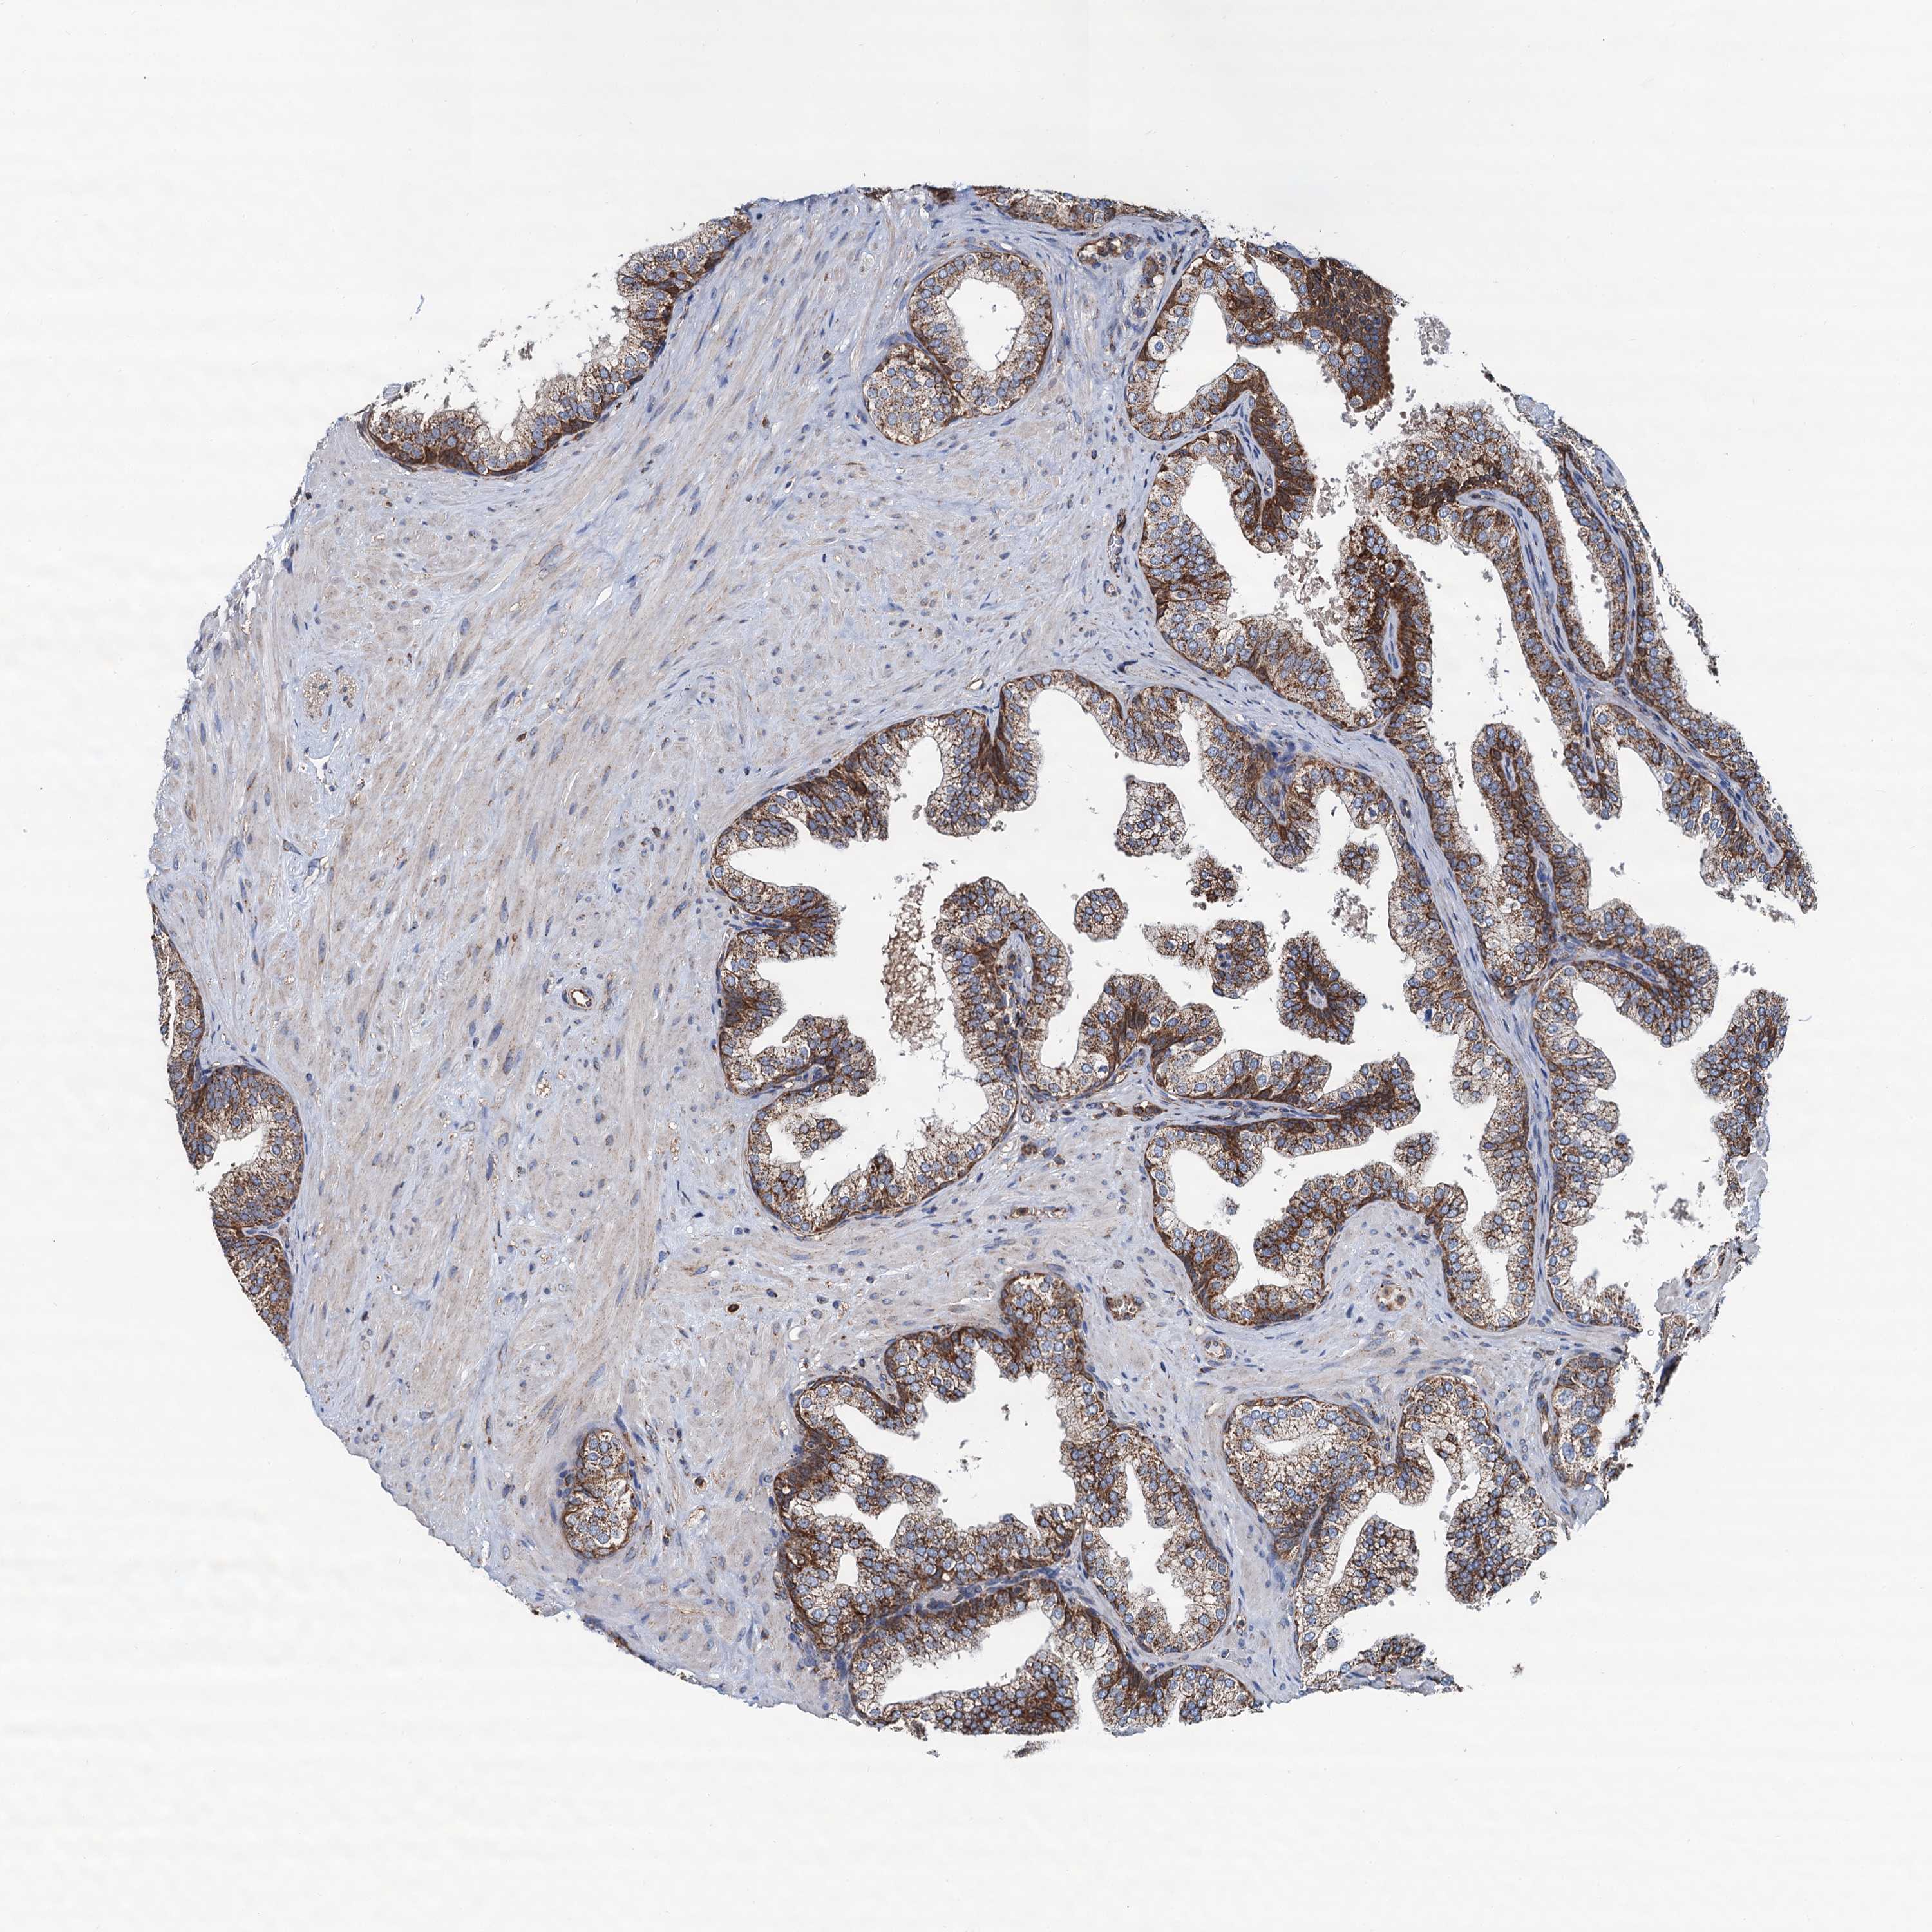
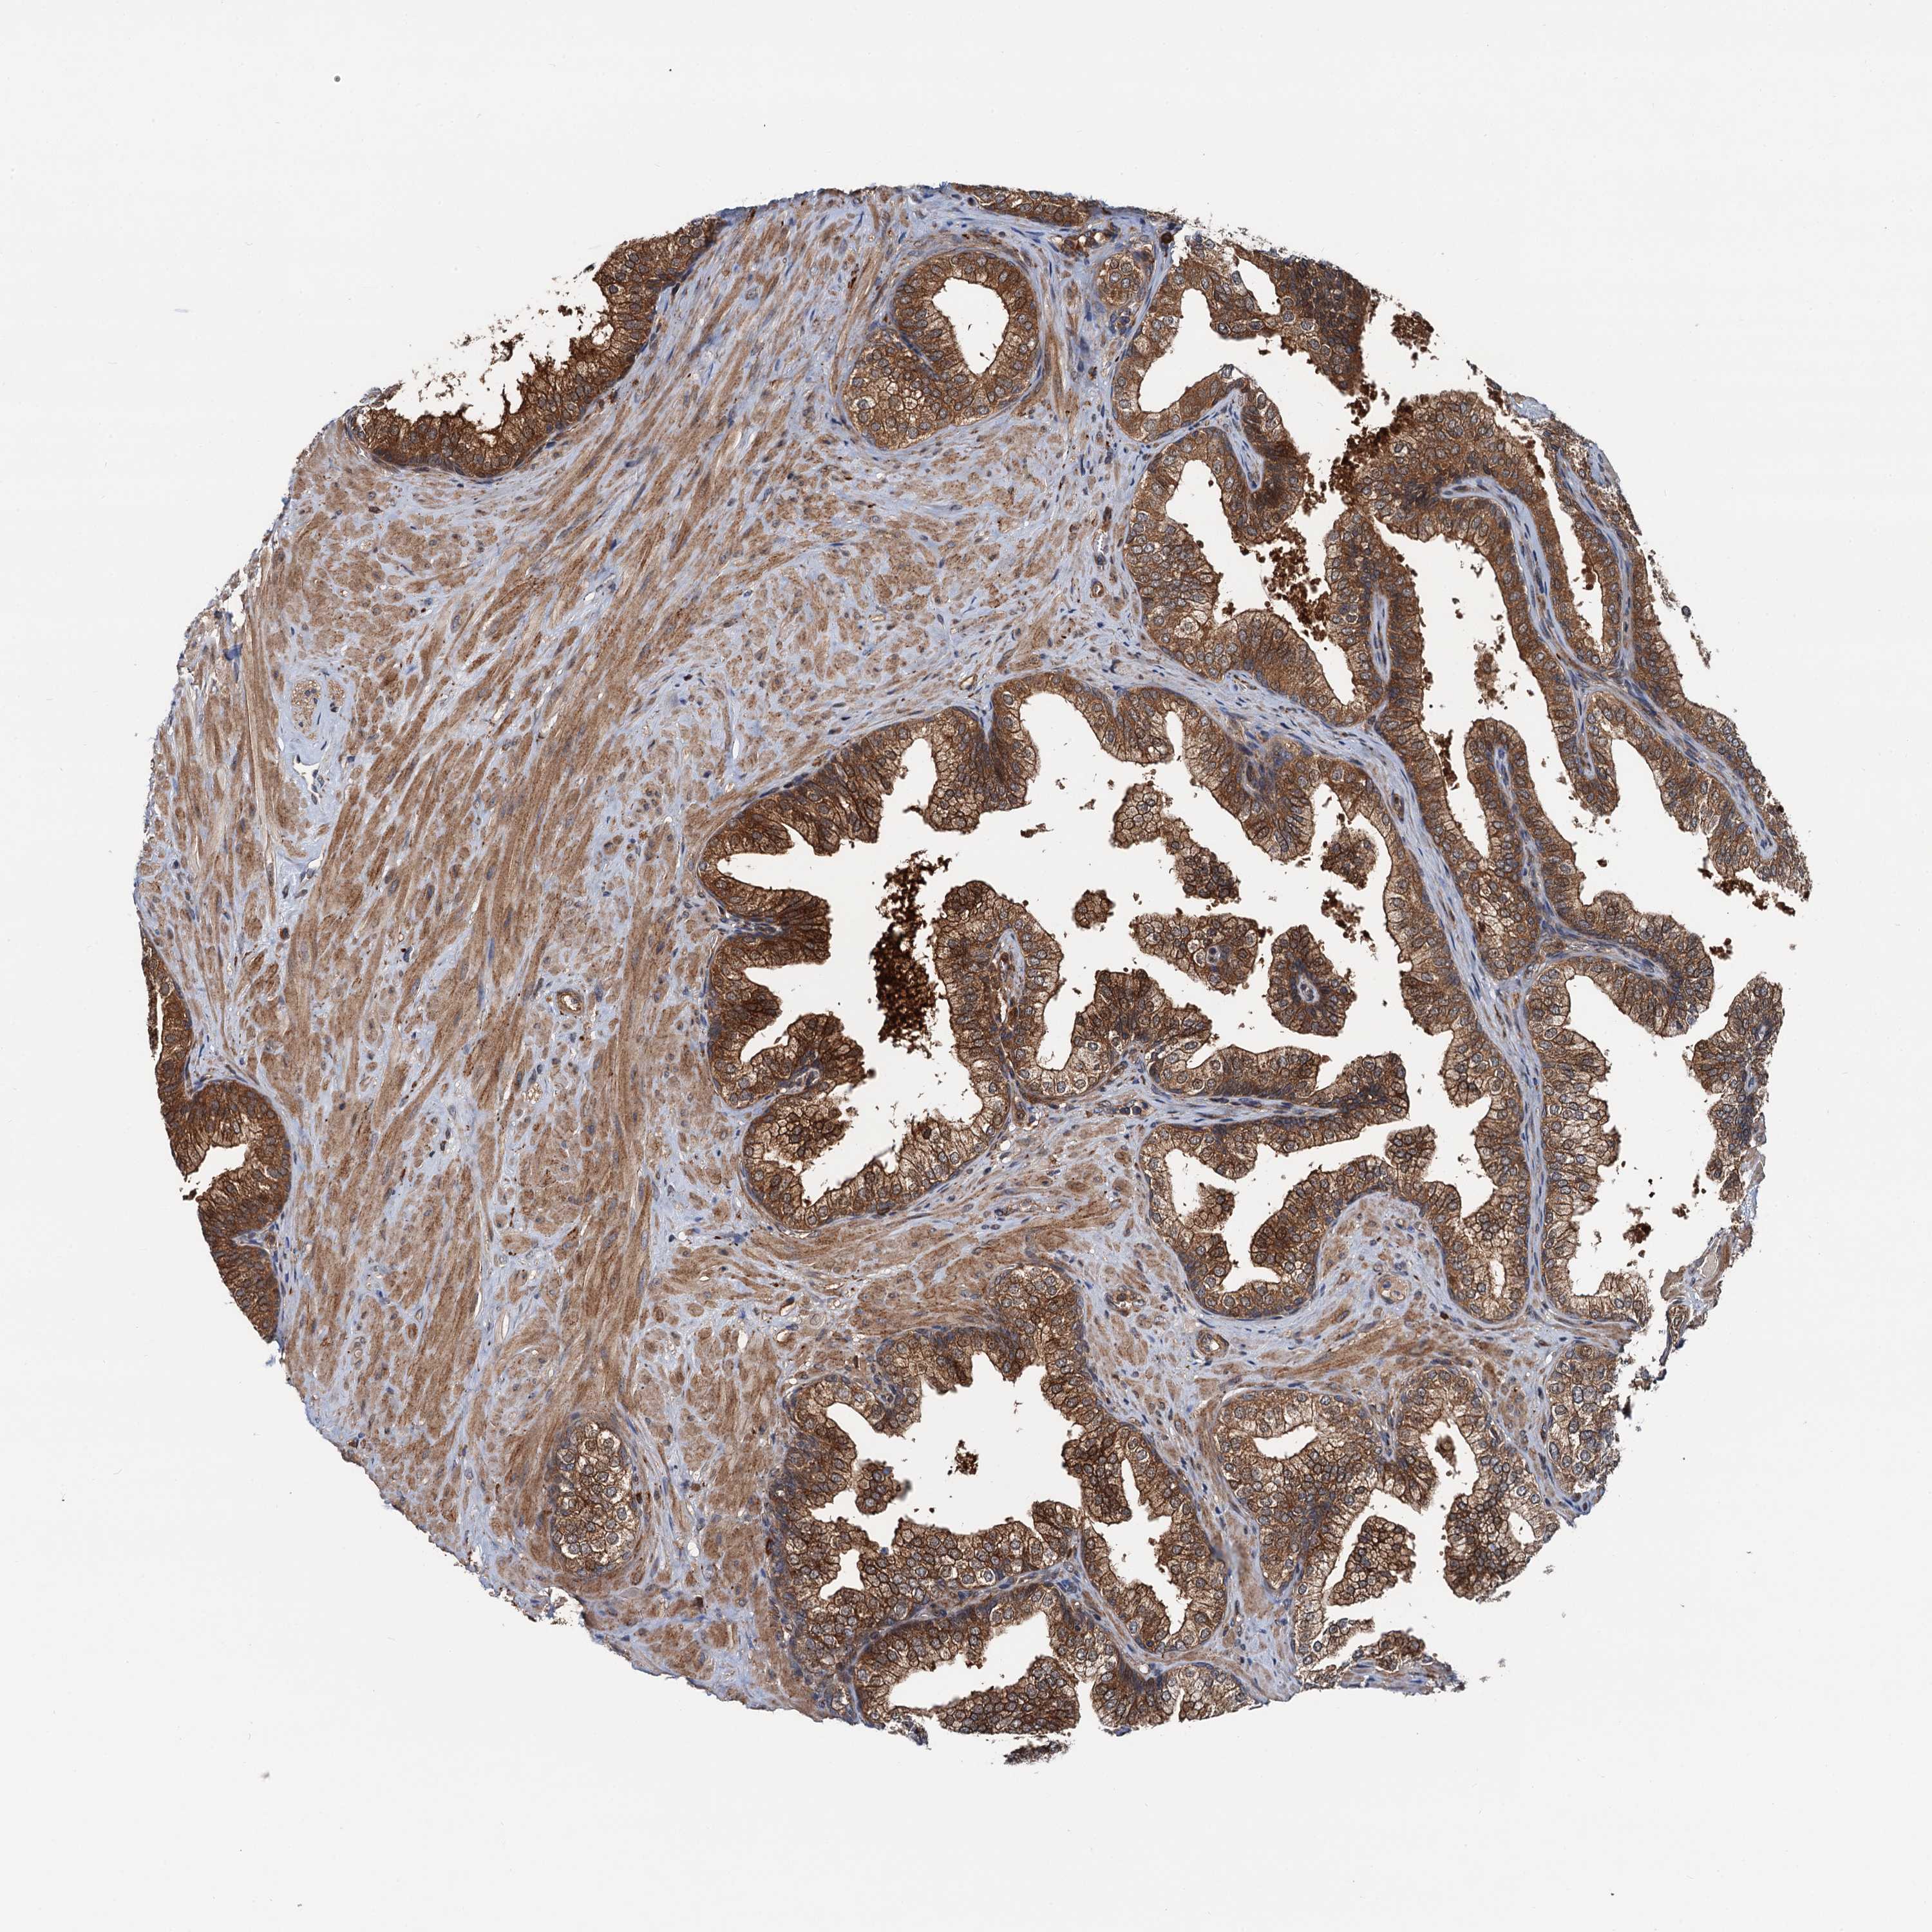
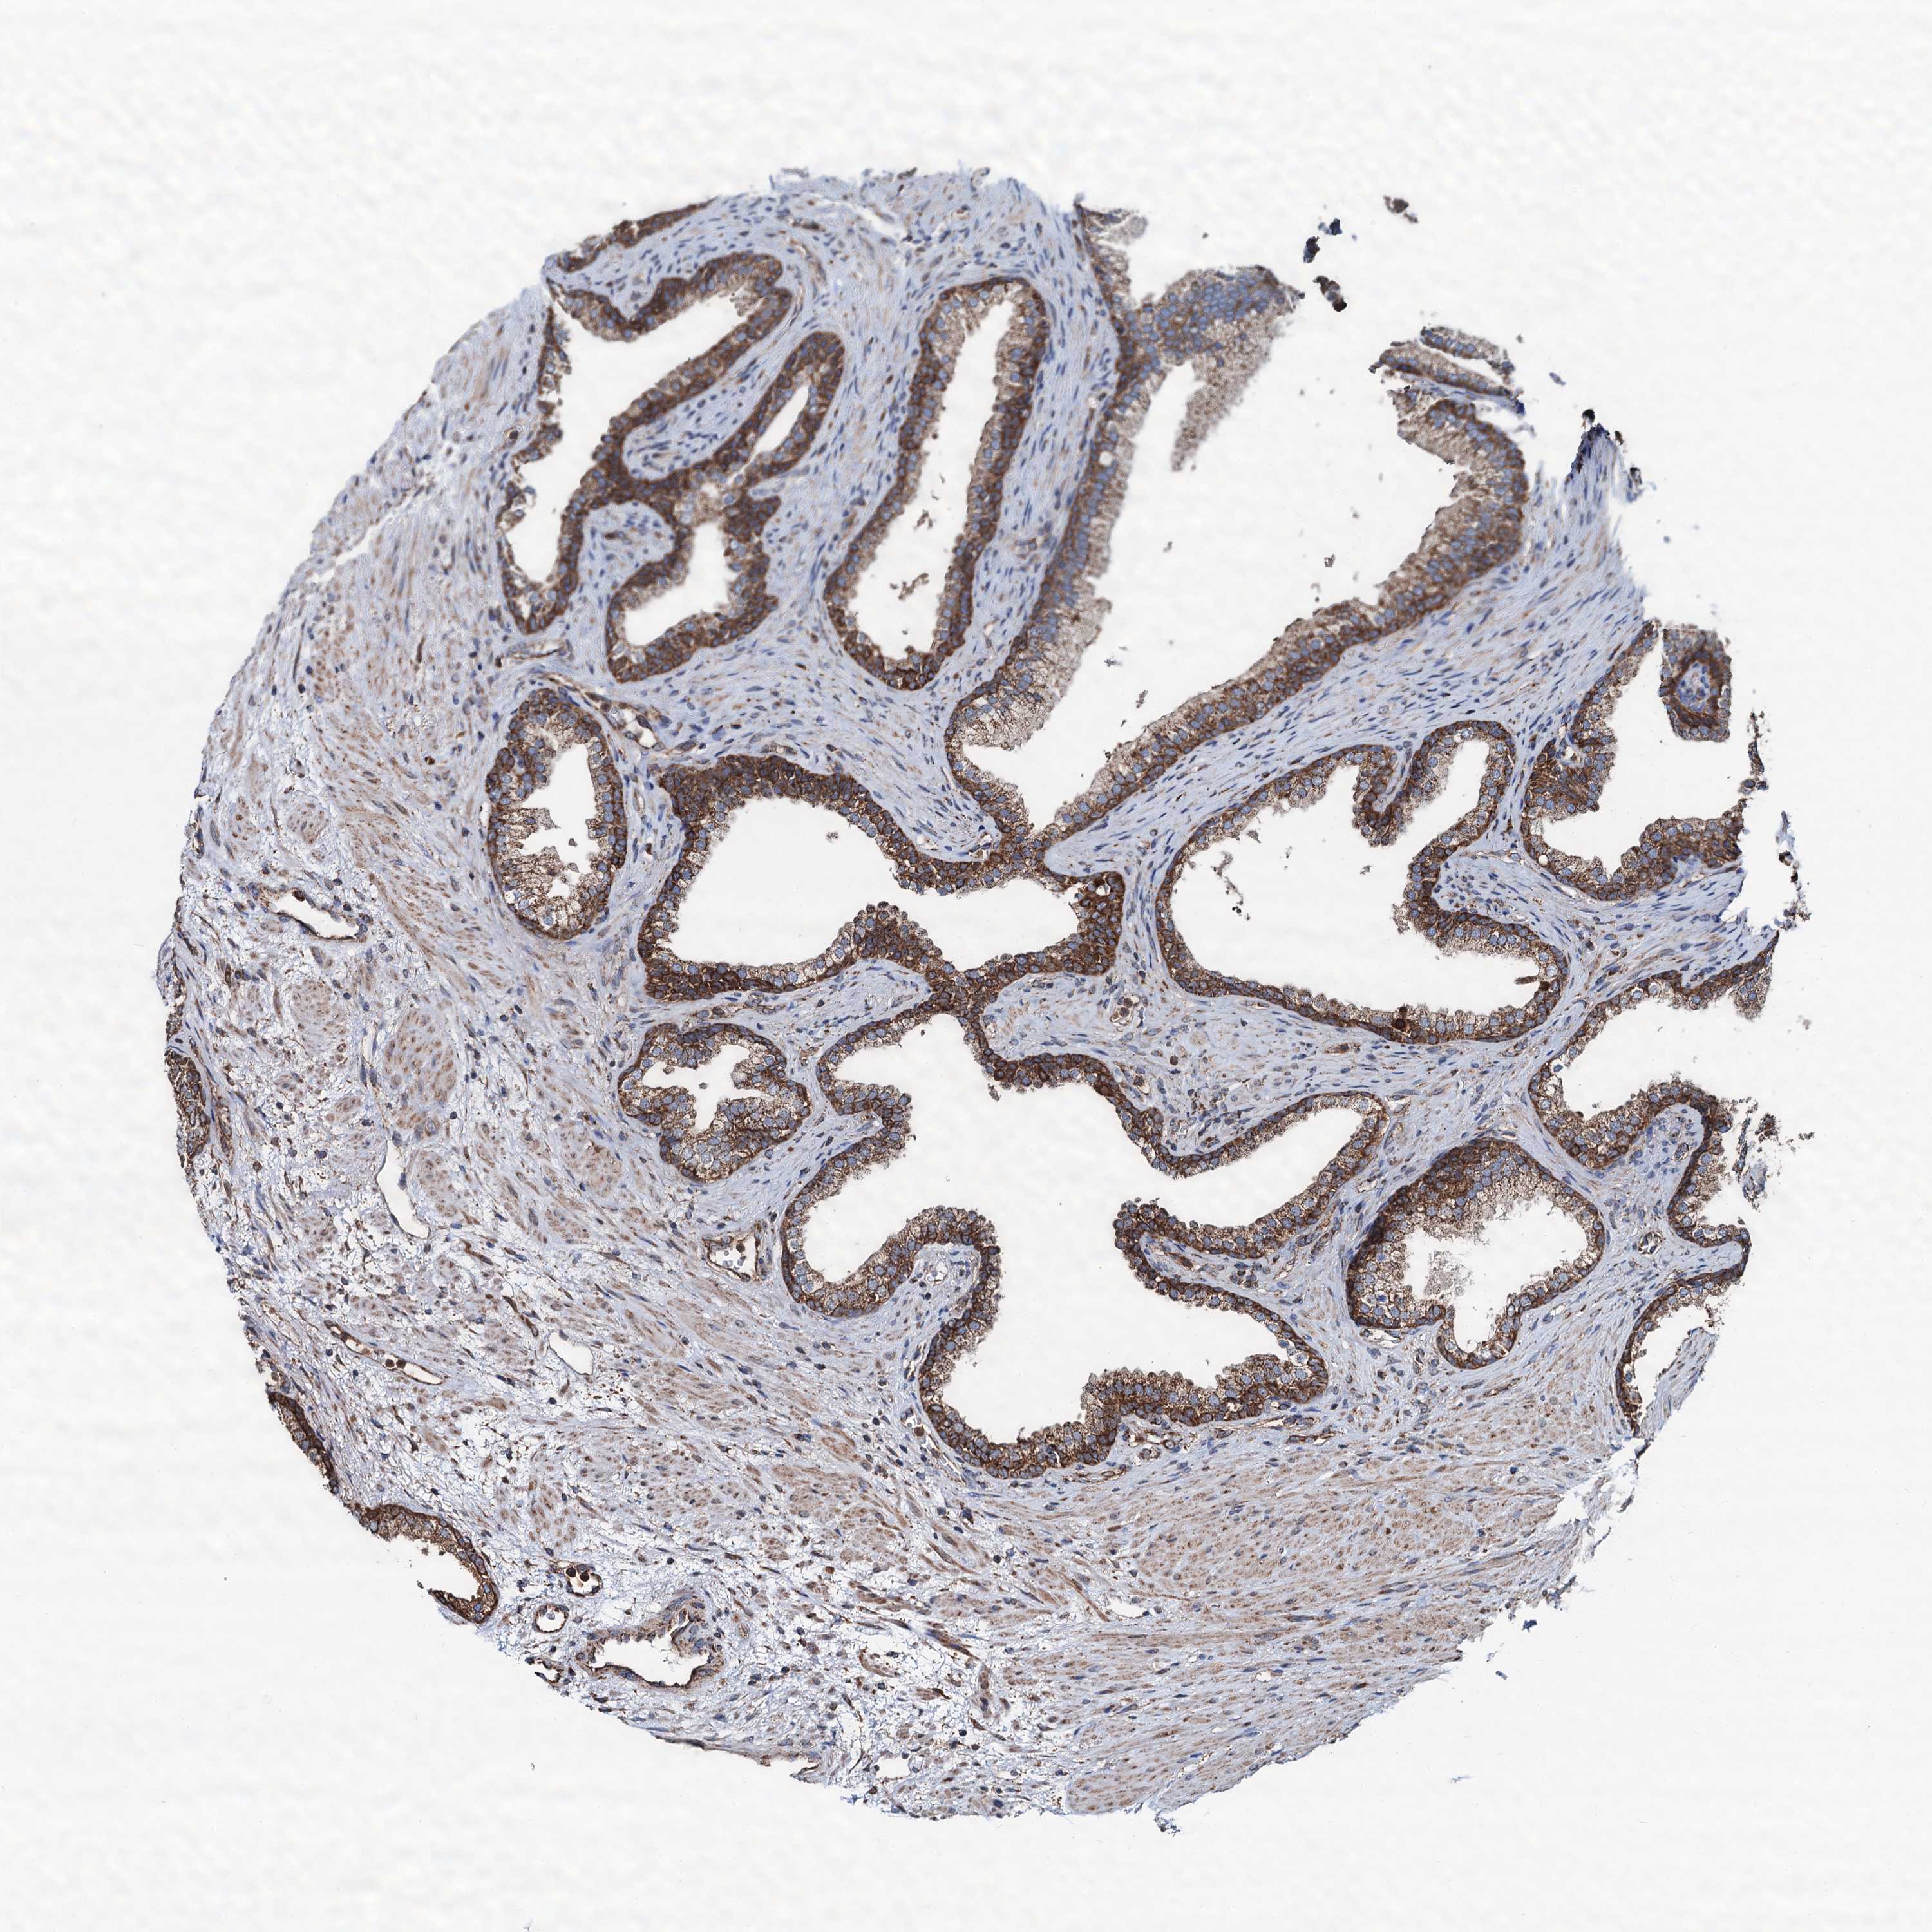
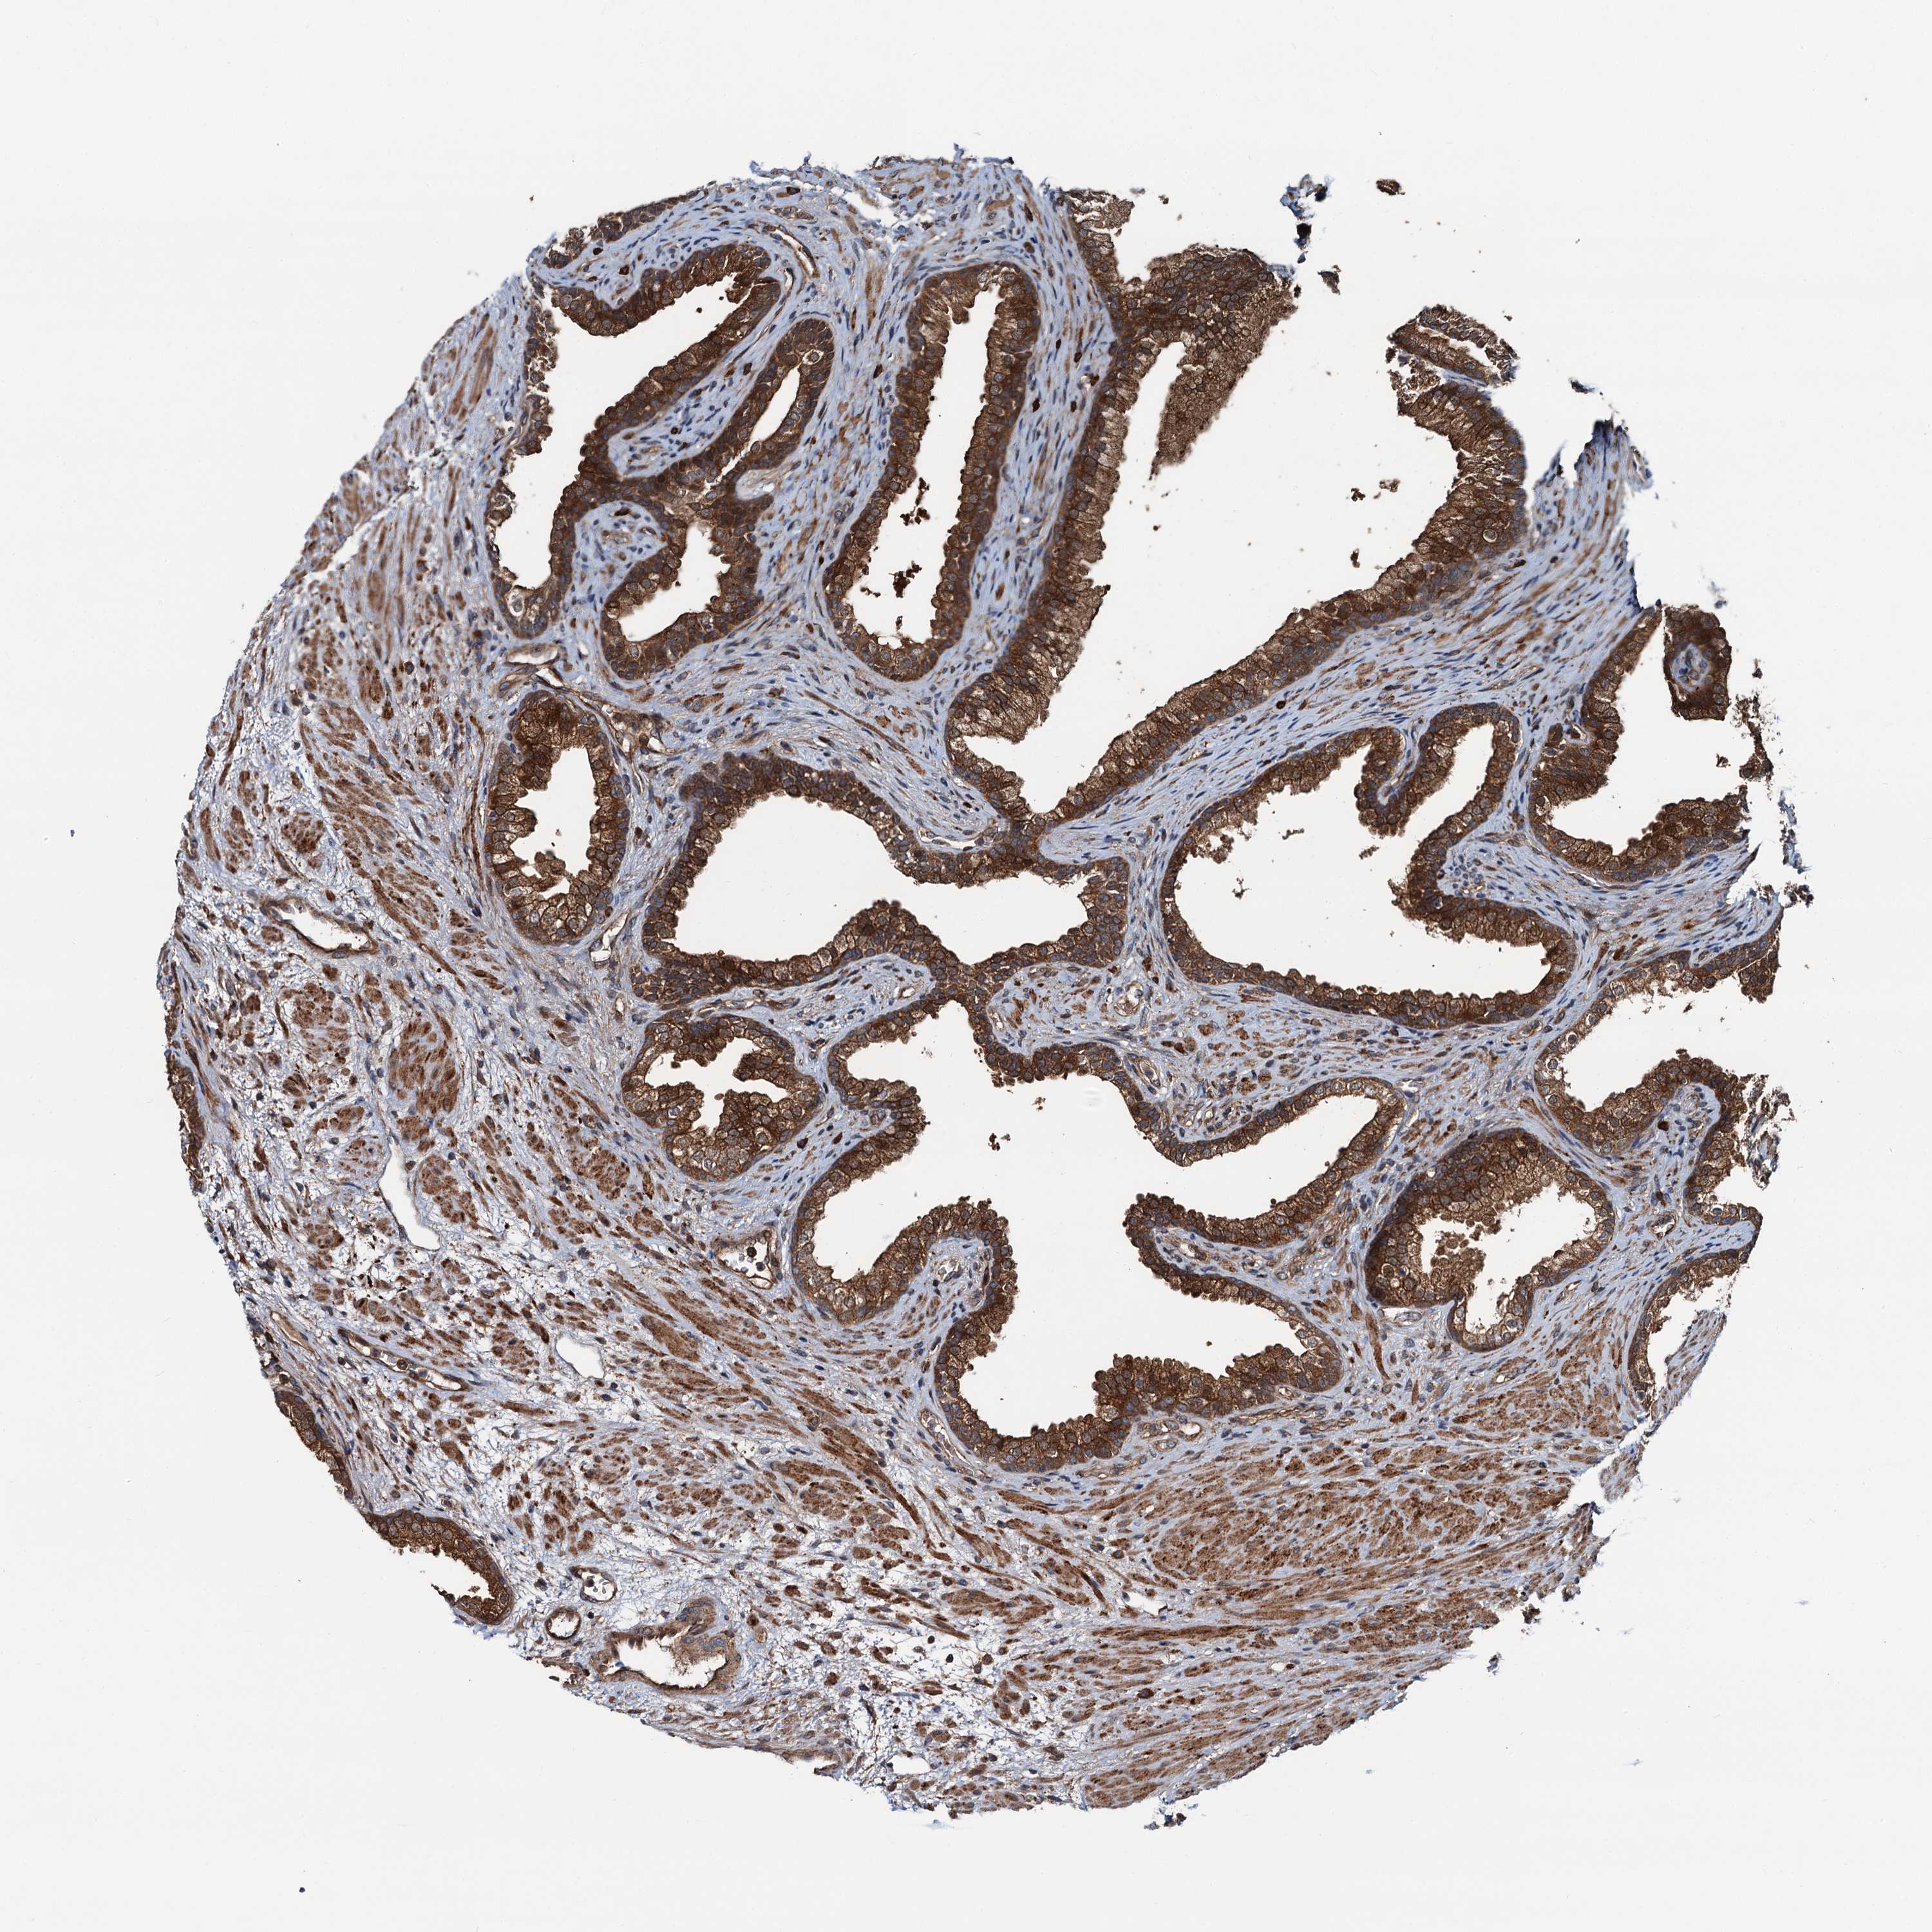
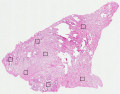
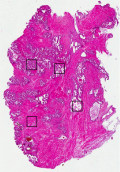
PROSTATE
GENE/PROTEIN
|
|
|||||||||||||||||||||||||||||||||||||||||||||||||||||||||||||||||||||||||||||||||||||||||||||||||||||||||||||||||||||||||||||||||||||||||||||||||||||||||||||||||||||||||||||||||||||||||||||||
The Project
The Human Protein Atlas


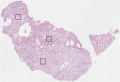
 Male, age 62
 Male, age 65
 Male, age 65
 Male, age 68
 Male, age 60
 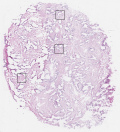 Male, age 66
 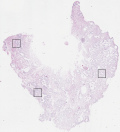 Male, age 63
 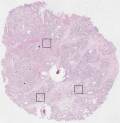 Male, age 66
  Male, age 58


