We use cookies to enhance the usability of our website. If you continue, we'll assume that you are happy to receive all cookies. More information. Don't show this again.
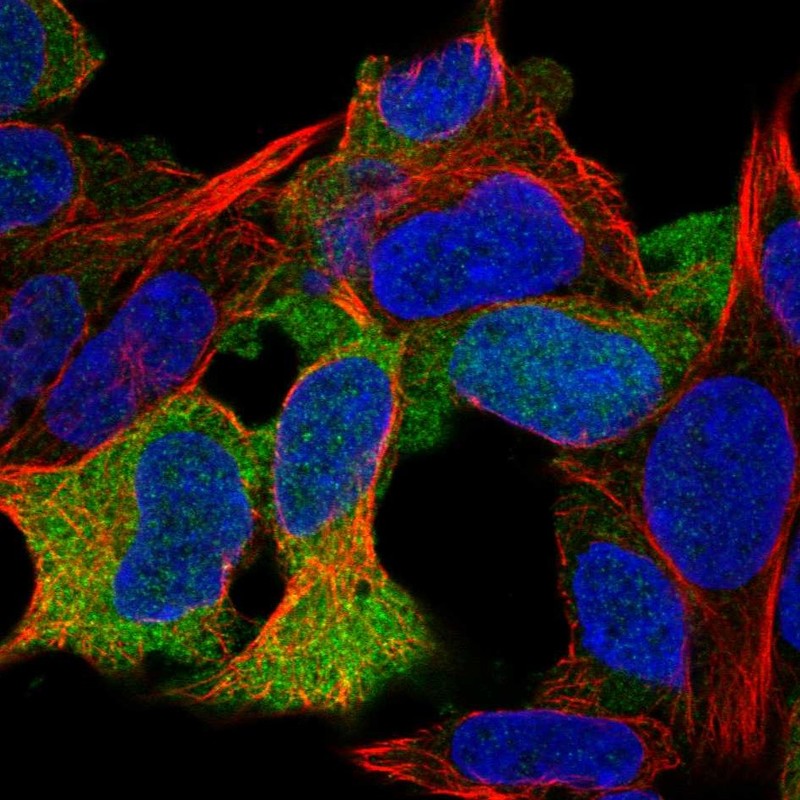
Immunofluorescent staining of human cell line HEK 293 shows localization to cytosol.
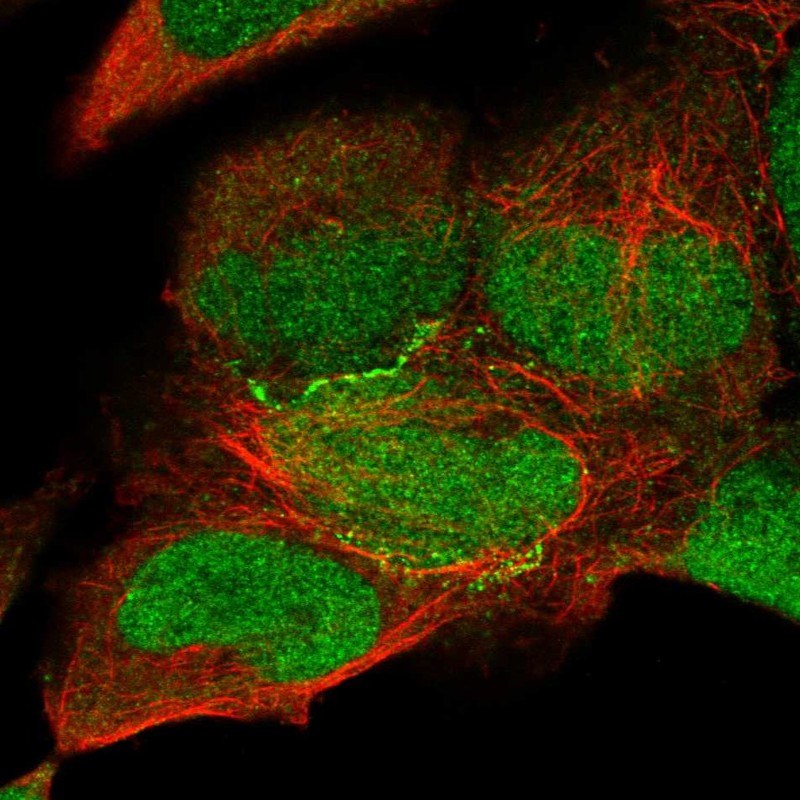
Immunofluorescent staining of human cell line HEK 293 shows localization to nucleus & cell junctions.
Antibody dilution
1:25
1:6
Literature conformity
The subcellular location is partly supported by literature or no literature is available.
The subcellular location is partly supported by literature or no literature is available.
IMMUNOHISTOCHEMISTRY
Antibody HPA020512
Antibody HPA021036
Antibody HPA061066
Standard validation
Uncertain
Uncertain
Figure description
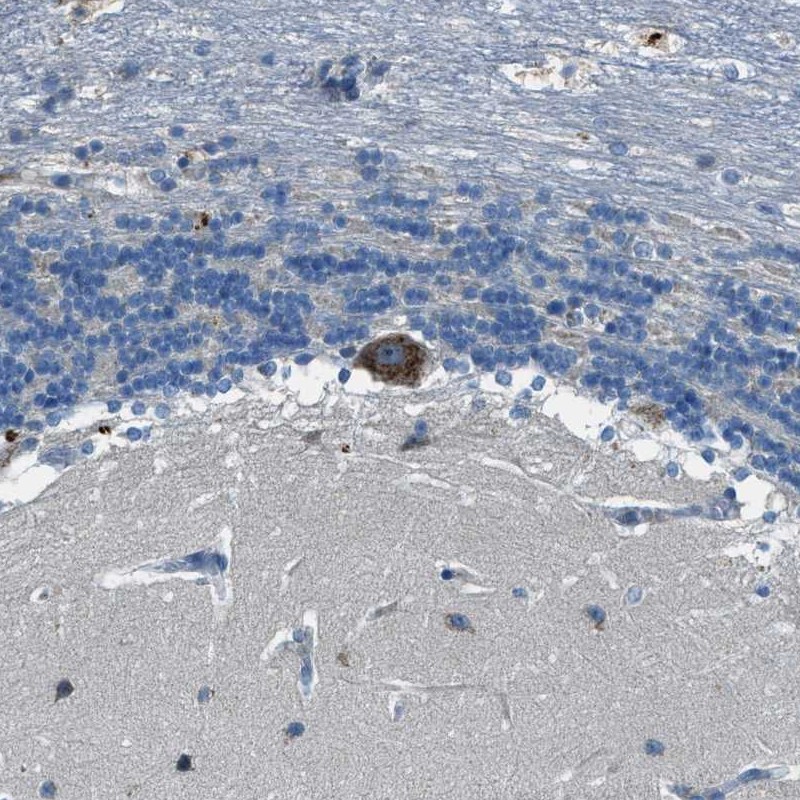
Immunohistochemical staining of human cerebellum shows strong cytoplasmic positivity in Purkinje cells.
Immunohistochemical staining of human cerebral cortex shows distinct cytoplasmic positivity in glial cells.
Expression
RNA: detected in 32 tissues Protein: detected in 41 cell types
RNA: detected in 32 tissues Protein: detected in 38 cell types
Retrieval
HIER pH6
HIER pH6
Antibody dilution
1:25
1:250
Literature conformity
No avaliable gene/protein characterization data.
No avaliable gene/protein characterization data.
RNA consistency
Not consistent with RNA expression data.
Mainly consistent with RNA expression data.
WESTERN BLOT
Antibody HPA020512
Antibody HPA021036
Antibody HPA061066
Standard validation
Uncertain
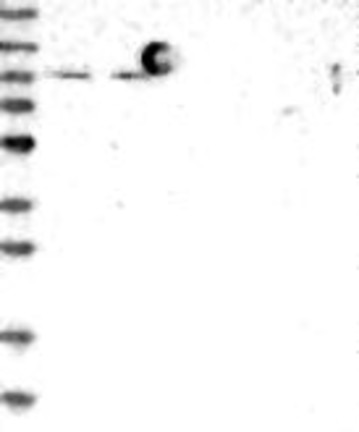
Analysis performed using a standard panel of samples. Single band differing more than +/-20% from predicted size in kDa and not supported by experimental and/or bioinformatic data.
Uncertain
Analysis performed using a standard panel of samples. Only bands not corresponding to the predicted size.
Uncertain
Analysis performed using a standard panel of samples. Single band differing more than +/-20% from predicted size in kDa and not supported by experimental and/or bioinformatic data.
Figure description
Lane 1: Marker [kDa] 230, 130, 95, 72, 56, 36, 28, 17, 11 Lane 2: RT4 Lane 3: U-251 MG Lane 4: Human Plasma Lane 5: Liver Lane 6: Tonsil
Lane 1: Marker [kDa] 250, 130, 95, 72, 55, 36, 28, 17, 10 Lane 2: RT4 Lane 3: U-251 MG Lane 4: Human Plasma Lane 5: Liver Lane 6: Tonsil
Target mass (kDa)
60.5, 59.6, 58.3, 54, 48.1, 34.4
60.5, 58.3, 54
60.5, 59.6, 58.3, 54, 34.4
Antibody dilution
1:250
1:250
1:80
PROTEIN ARRAY
Antibody HPA020512
Antibody HPA021036
Antibody HPA061066
Standard validation
Supported
Pass with single peak corresponding to interaction only with its own antigen.
Supported
Pass with single peak corresponding to interaction only with its own antigen.
Supported
Pass with single peak corresponding to interaction only with its own antigen.
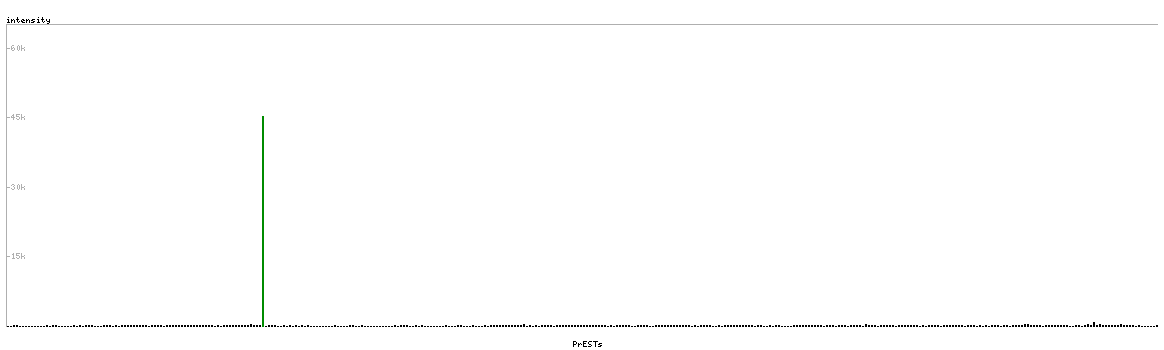
Figure description
Antibody specificity analysis with protein arrays. Predicted and matching interactions are shown in green.
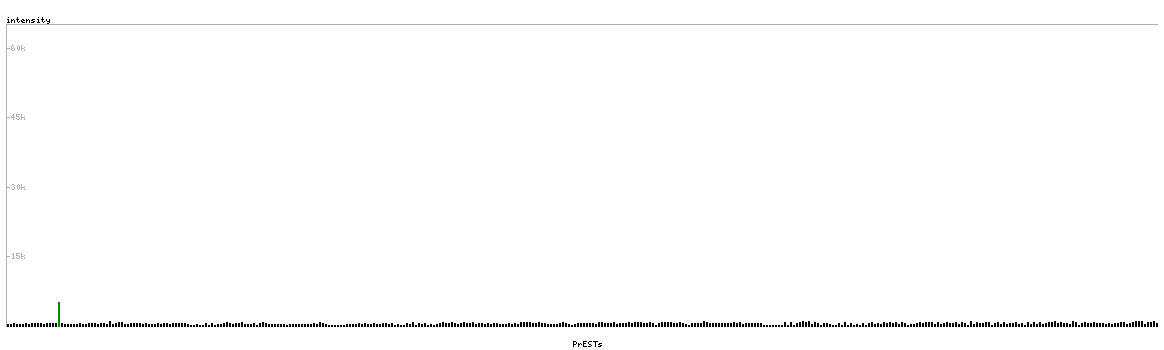
Antibody specificity analysis with protein arrays. Predicted and matching interactions are shown in green.
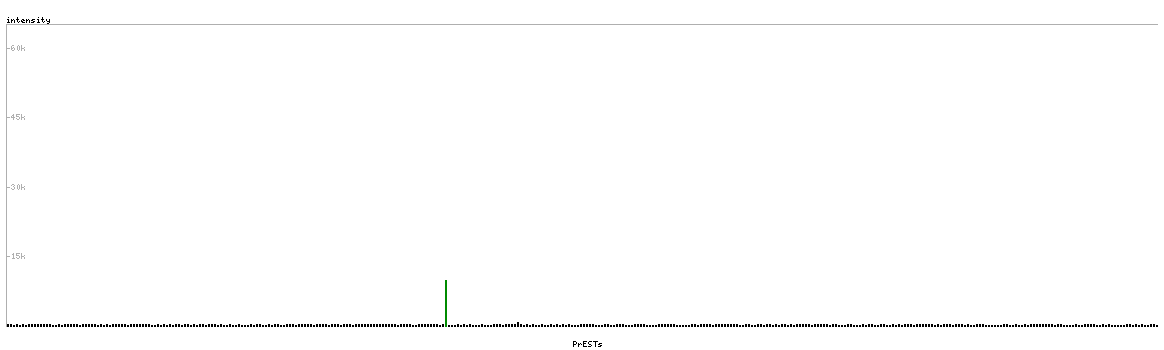
Antibody specificity analysis with protein arrays. Predicted and matching interactions are shown in green.