We use cookies to enhance the usability of our website. If you continue, we'll assume that you are happy to receive all cookies. More information. Don't show this again.
Pearson correlation >0.6 for protein expression in cell lines using independent antibodies.
Validated
Pearson correlation >0.6 for protein expression in cell lines using independent antibodies.
Figure description
Distribution of protein expression (antibody staining). Pearson correlation with HPA053176 across 46 cell lines.
Distribution of protein expression (antibody staining). Pearson correlation with HPA050162 across 46 cell lines.
Formal validation: Independent
Validated
Spearman correlation >0.6 for protein expression in tissues using independent antibodies.
Validated
Spearman correlation >0.6 for protein expression in tissues using independent antibodies.
Figure description
Distribution of protein expression (antibody staining). Spearman correlation with HPA053176 across 75 cell types.
Distribution of protein expression (antibody staining). Spearman correlation with HPA050162 across 75 cell types.
Standard validation
Supported
Supported
Supported
Supported
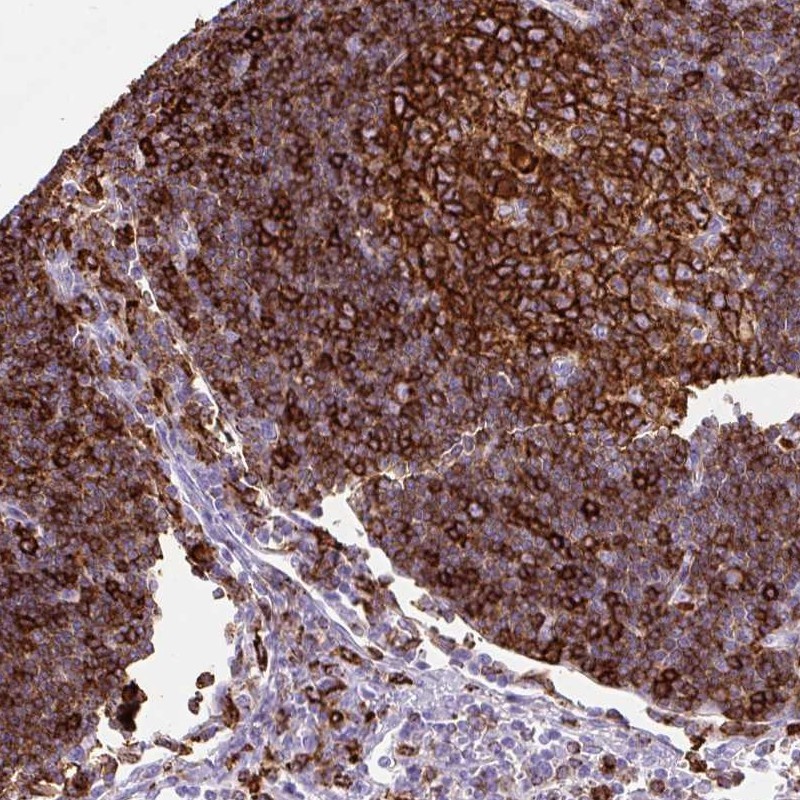
Figure description
Immunohistochemical staining of human lymph node shows strong cytoplasmic positivity in germinal center cells and non-germinal center cells.
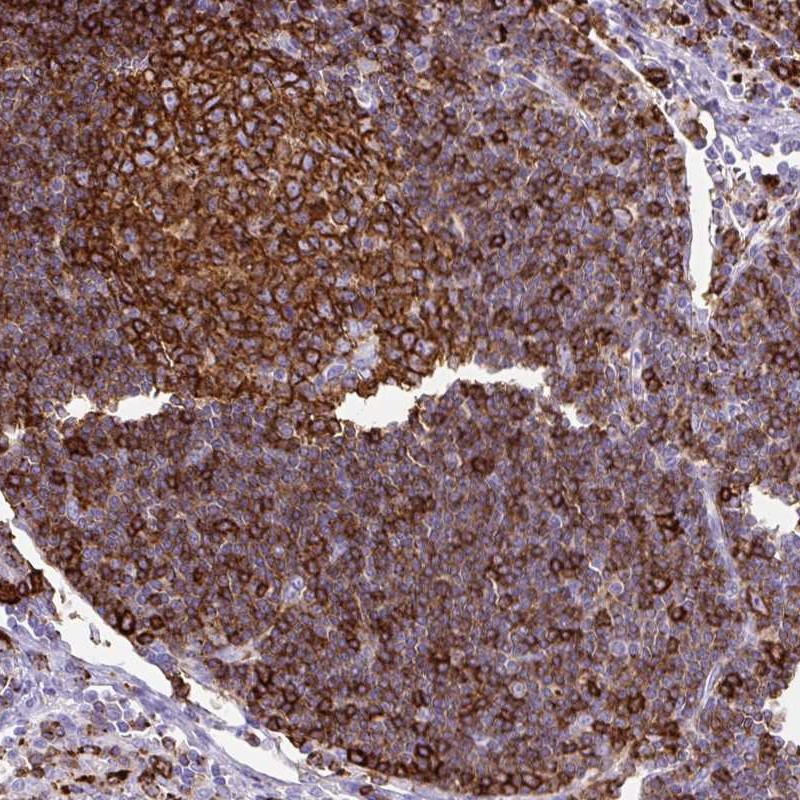
Immunohistochemical staining of human lymph node shows strong cytoplasmic positivity in germinal and non-germinal center cells.
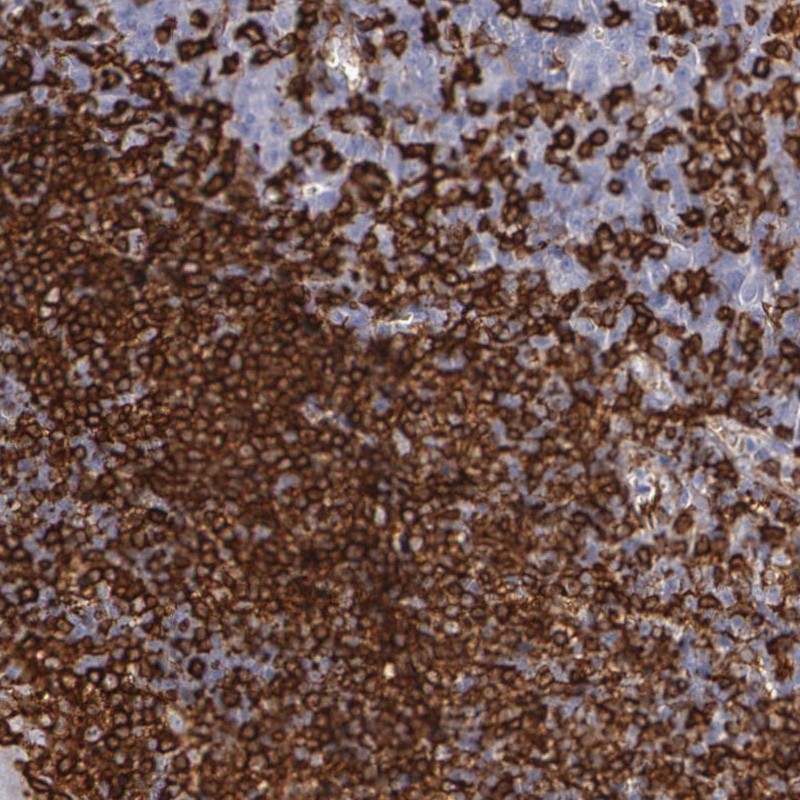
Immunohistochemical staining of human tonsil shows cytoplasmic positivity in leukocytes.
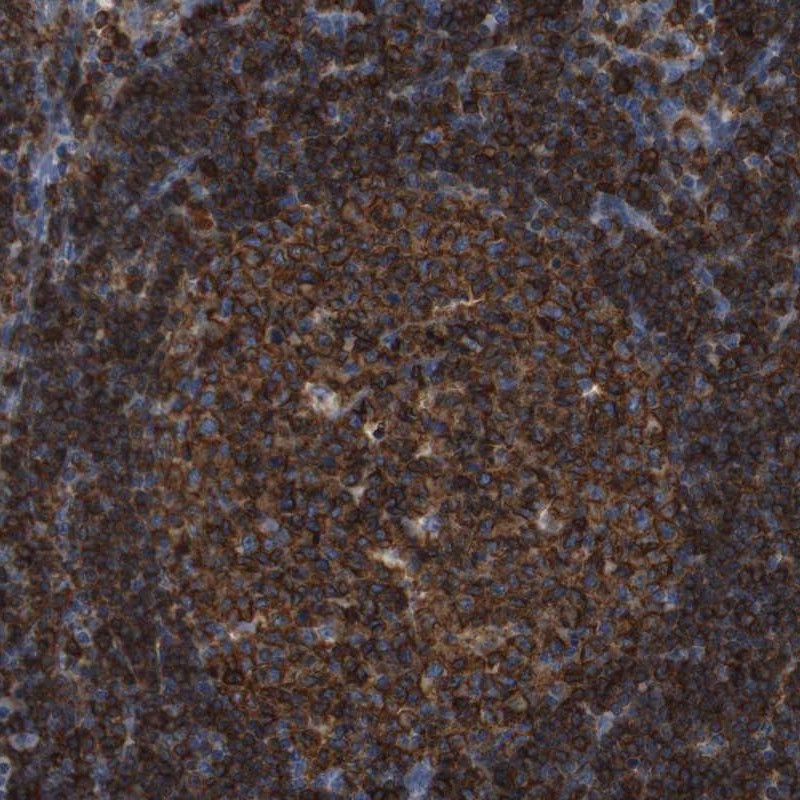
Immunohistochemical staining of human lymph node shows strong cytoplasmic positivity in both reaction center cells and lymphoid cells outside reaction centra.
Expression
RNA: detected in 32 tissues Protein: detected in 34 cell types
RNA: detected in 32 tissues Protein: detected in 27 cell types
RNA: detected in 32 tissues Protein: detected in 48 cell types
RNA: detected in 32 tissues Protein: detected in 46 cell types
Retrieval
HIER pH6
HIER pH6
HIER pH6
HIER pH6
Antibody dilution
1:75
1:400
1:250
1:1600
Literature conformity
Consistent with extensive gene/protein characterization data.
Consistent with extensive gene/protein characterization data.
Consistent with extensive gene/protein characterization data.
Consistent with extensive gene/protein characterization data.
RNA consistency
Consistent with RNA expression data.
Consistent with RNA expression data.
Consistent with RNA expression data.
Consistent with RNA expression data.
WESTERN BLOT
Antibody HPA050162
Antibody HPA053176
Antibody CAB002798
Antibody CAB015402
Standard validation
Supported
Analysis performed using a standard panel of samples. Single band corresponding to the predicted size in kDa (+/-20%).
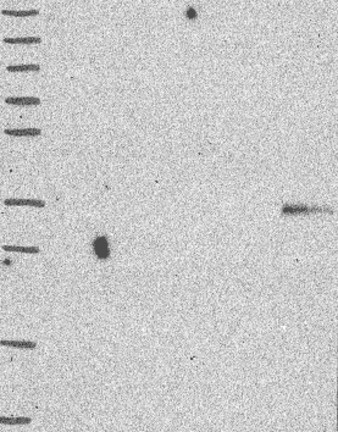
Uncertain
Analysis performed using a standard panel of samples. No bands detected.
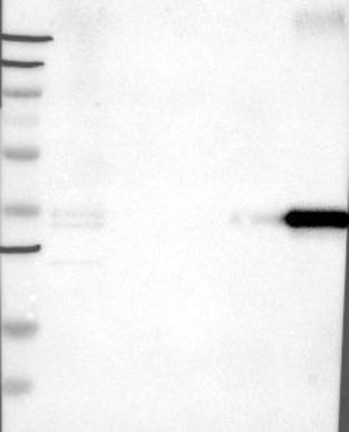
Supported
Analysis performed using a standard panel of samples. Single band corresponding to the predicted size in kDa (+/-20%).
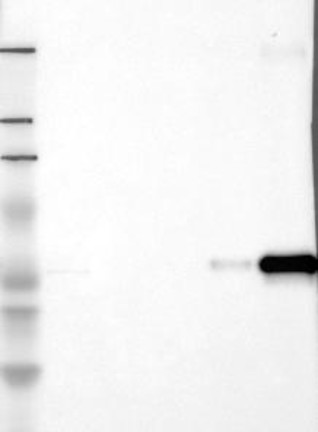
Supported
Analysis performed using a standard panel of samples. Band of predicted size in kDa (+/-20%) with additional bands present.
Figure description
Lane 1: Marker [kDa] 250, 130, 95, 72, 55, 36, 28, 17, 10 Lane 2: RT4 Lane 3: U-251 MG Lane 4: Human Plasma Lane 5: Liver Lane 6: Tonsil
Lane 1: Marker [kDa] 250, 130, 95, 72, 55, 36, 28, 17, 10 Lane 2: RT4 Lane 3: U-251 MG Lane 4: Human Plasma Lane 5: Liver Lane 6: Tonsil
Lane 1: Marker [kDa] 250, 130, 95, 72, 55, 36, 28, 17, 11 Lane 2: RT4 Lane 3: U-251 MG Lane 4: Human Plasma Lane 5: Liver Lane 6: Tonsil
Lane 1: Marker [kDa] 229, 107, 78, 46, 31, 26, 16.2 Lane 2: RT4 Lane 3: U-251 MG Lane 4: Human Plasma Lane 5: Liver Lane 6: Tonsil
Target mass (kDa)
28.6
28.6, 25.9
28.6, 25.9
28.6, 25.9
Antibody dilution
1:80
1:80
1:500
1:500
PROTEIN ARRAY
Antibody HPA050162
Antibody HPA053176
Antibody CAB002798
Antibody CAB015402
Standard validation
Approved
Pass with quality comment low specificity (binding to 1-2 PrESTs >15% and <40%).
Supported
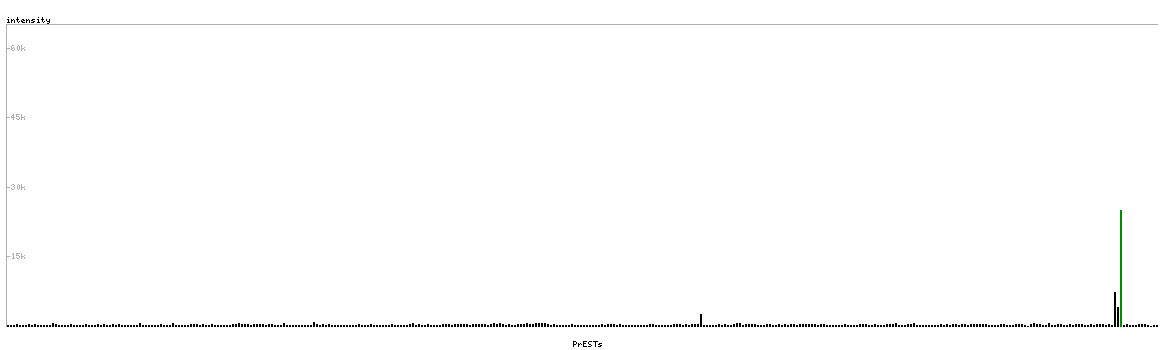
Pass with single peak corresponding to interaction only with its own antigen.
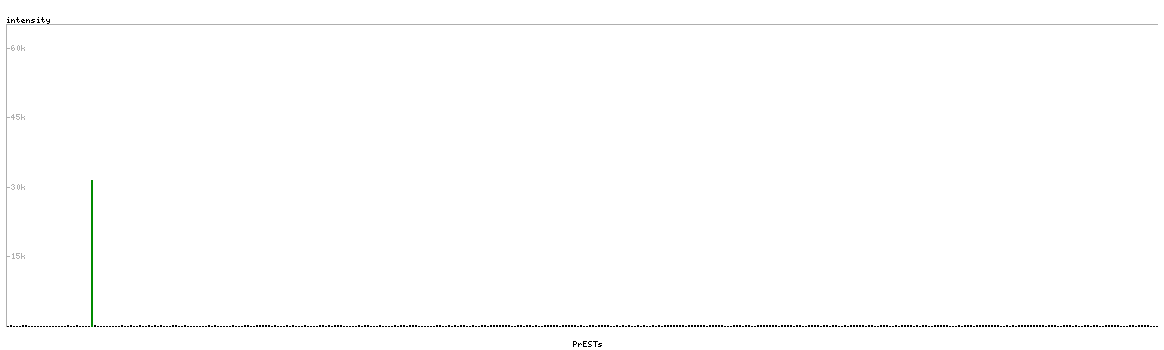
Figure description
Antibody specificity analysis with protein arrays. Predicted and matching interactions are shown in green.
Antibody specificity analysis with protein arrays. Predicted and matching interactions are shown in green.