TISSUE
CELL
CANCER
Antibody validation
Dictionary
Tissue proteome
GENERAL INFORMATION
Gene name
Gene description
Protein class
Predicted localization
Number of transcripts
HUMAN PROTEIN ATLAS INFORMATION
RNA tissue category
Protein evidence
Protein expression
DATA RELIABILITY
Data reliabilitydescription
Reliability score
RNA AND PROTEIN EXPRESSION SUMMARY
PROTEIN EXPRESSION OVERVIEW
RNA EXPRESSION OVERVIEW
GENE INFORMATION
Synonyms
Description
Entrez gene summary
Chromosome
Cytoband
Chromosome location (bp)
Ensembl
Entrez gene
UniProt
neXtProt
Antibodypedia
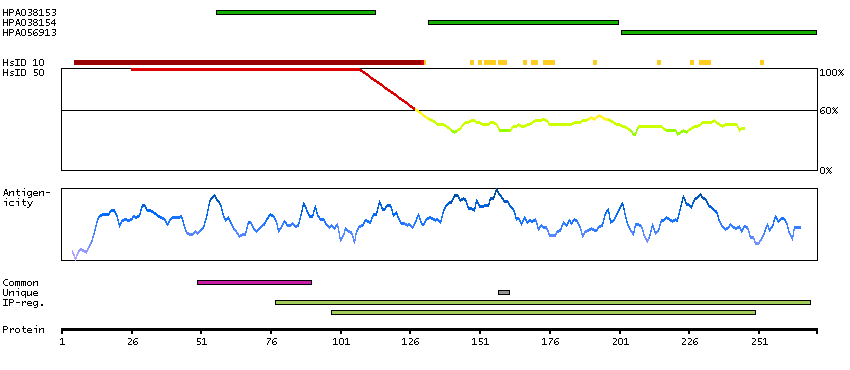
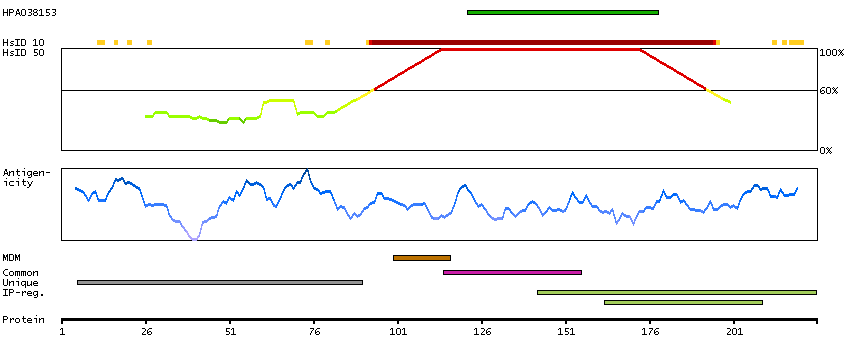
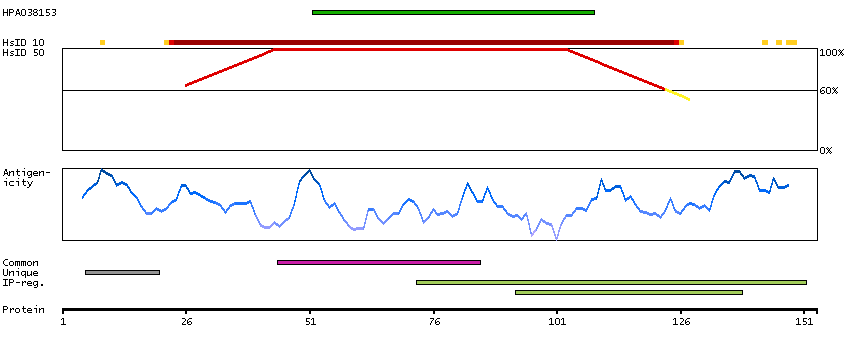
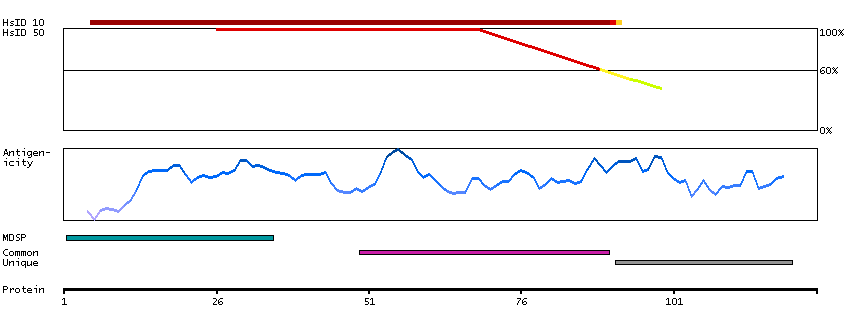
PROTEIN BROWSER
PROTEIN INFORMATION
Splice variant
Gene ontology
Length & mass
Signal peptide(predicted)
Transmembrane regions(predicted)