We use cookies to enhance the usability of our website. If you continue, we'll assume that you are happy to receive all cookies. More information. Don't show this again.
Pearson correlation >0.6 for protein expression in cell lines using independent antibodies.
Validated
Pearson correlation >0.6 for protein expression in cell lines using independent antibodies.
Figure description
Distribution of protein expression (antibody staining). Pearson correlation with HPA041949 across 45 cell lines.
Distribution of protein expression (antibody staining). Pearson correlation with HPA041868 across 45 cell lines.
Standard validation
Supported
Supported
Figure description
Immunohistochemical staining of human placenta shows strong cytoplasmic positivity in trophoblastic cells.
Immunohistochemical staining of human placenta shows strong cytoplasmic positivity in trophoblastic cells.
Expression
RNA: detected in 37 tissues Protein: detected in 55 cell types
RNA: detected in 37 tissues Protein: detected in 63 cell types
Retrieval
HIER pH6
HIER pH6
Antibody dilution
1:25
1:40
Literature conformity
No avaliable gene/protein characterization data.
No avaliable gene/protein characterization data.
RNA consistency
Mainly consistent with RNA expression data.
Mainly consistent with RNA expression data.
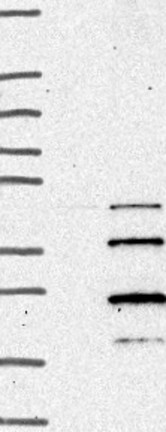
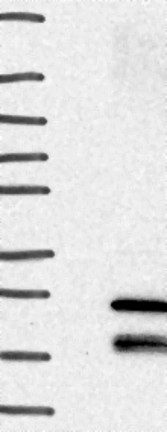
WESTERN BLOT
Antibody HPA041868
Antibody HPA041949
Standard validation
Supported
Band of predicted size in kDa (+/-20%) with additional bands present.
Supported
Band of predicted size in kDa (+/-20%) with additional bands present.
Figure description
Lane 1: Marker [kDa] 250, 130, 95, 72, 55, 36, 28, 17, 10 Lane 2: Negative control (vector only transfected HEK293T lysate) Lane 3: Over-expression Lysate (Co-expressed with a C-terminal myc-DDK tag (~3.1 kDa) in mammalian HEK293T cells, LY415449)
Lane 1: Marker [kDa] 250, 130, 95, 72, 55, 36, 28, 17, 10 Lane 2: Negative control (vector only transfected HEK293T lysate) Lane 3: Over-expression Lysate (Co-expressed with a C-terminal myc-DDK tag (~3.1 kDa) in mammalian HEK293T cells, LY415449)
Target mass (kDa)
19.6, 15.5, 11.8
19.6, 11.8
Antibody dilution
1:250
1:250
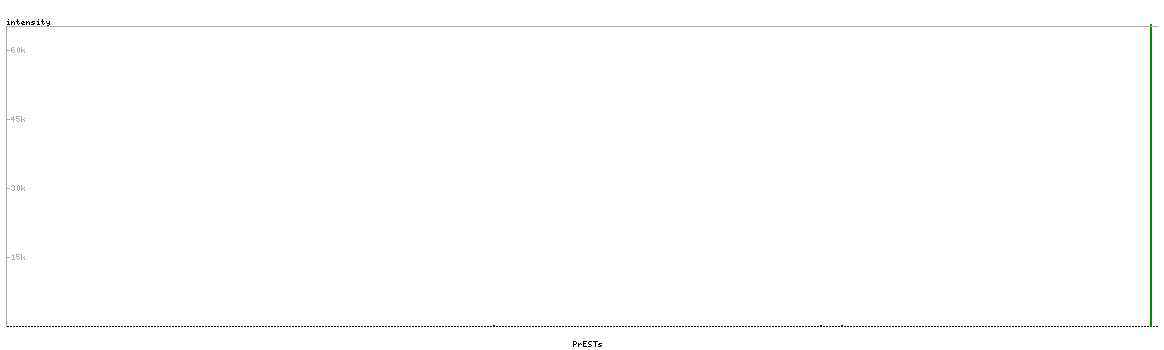
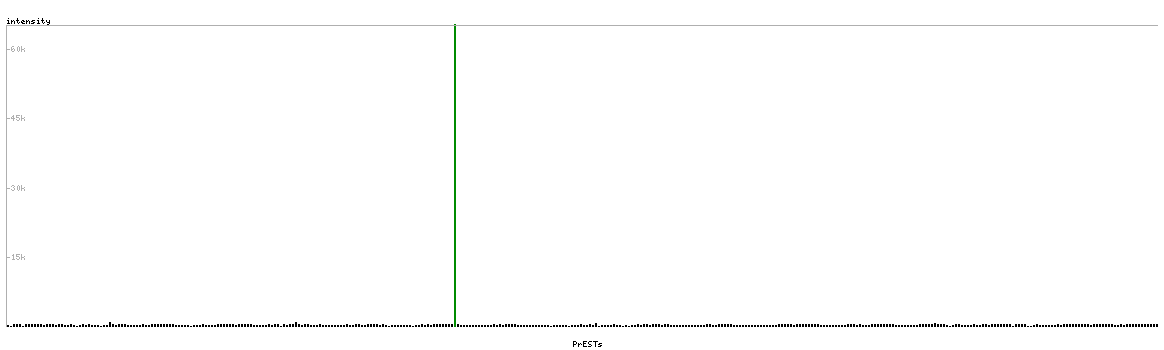
PROTEIN ARRAY
Antibody HPA041868
Antibody HPA041949
Standard validation
Supported
Pass with single peak corresponding to interaction only with its own antigen.
Supported
Pass with single peak corresponding to interaction only with its own antigen.
Figure description
Antibody specificity analysis with protein arrays. Predicted and matching interactions are shown in green.
Antibody specificity analysis with protein arrays. Predicted and matching interactions are shown in green.