We use cookies to enhance the usability of our website. If you continue, we'll assume that you are happy to receive all cookies. More information. Don't show this again.
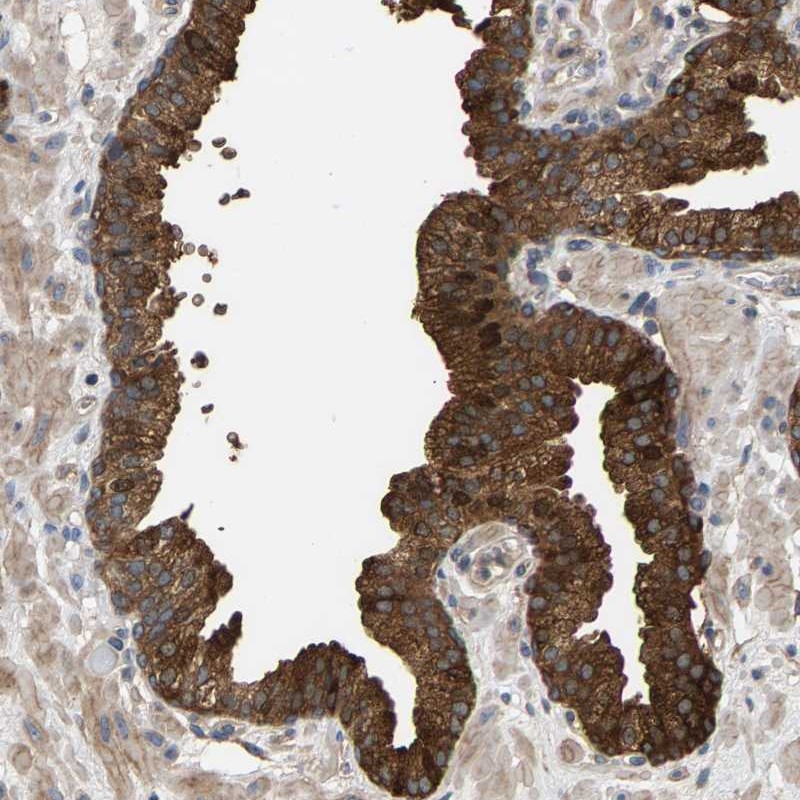
Immunohistochemical staining of human prostate shows strong cytoplasmic positivity in glandular cells.
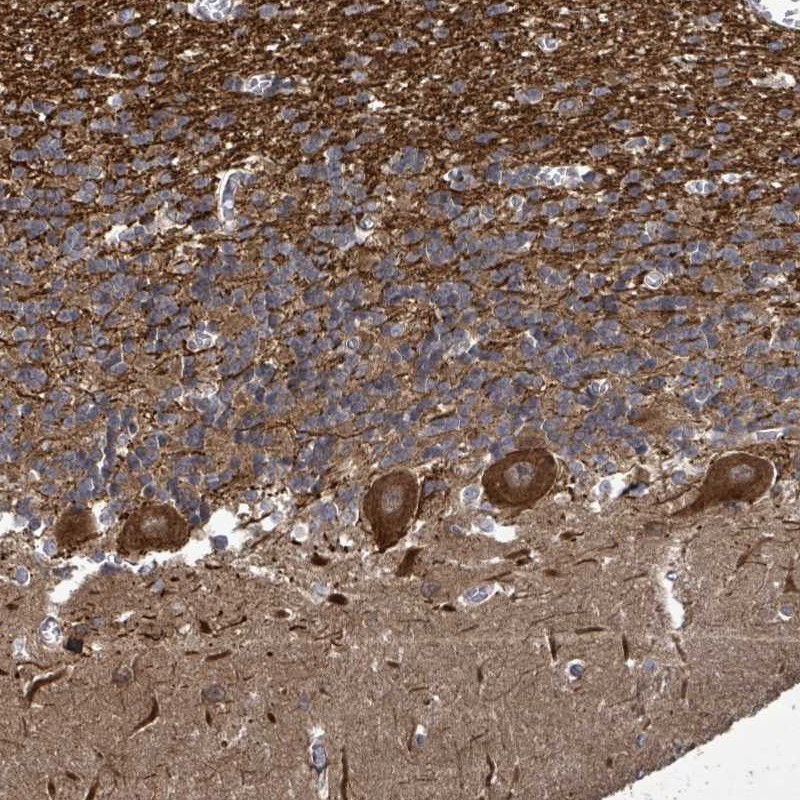
Immunohistochemical staining of human cerebellum shows strong cytoplasmic positivity in Purkinje cells.
Expression
RNA: detected in 0 tissues Protein: detected in 62 cell types
RNA: detected in 0 tissues Protein: detected in 68 cell types
Retrieval
HIER pH6
HIER pH6
Antibody dilution
1:200
1:75
Literature conformity
No avaliable gene/protein characterization data.
No avaliable gene/protein characterization data.
RNA consistency
Not consistent with RNA expression data.
Not consistent with RNA expression data.
WESTERN BLOT
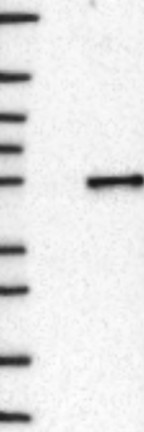
Antibody HPA021522
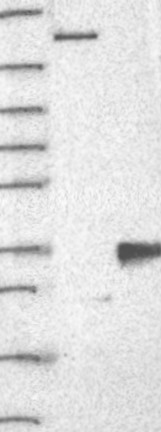
Antibody HPA048826
Standard validation
Uncertain
Single band differing more than +/-20% from predicted size in kDa and not supported by experimental and/or bioinformatic data.
Supported
Single band corresponding to the predicted size in kDa (+/-20%).
Figure description
Lane 1: Marker [kDa] 250, 130, 95, 72, 55, 36, 28, 17, 10 Lane 2: Negative control (vector only transfected HEK293T lysate) Lane 3: Over-expression Lysate (Co-expressed with a C-terminal myc-DDK tag (~3.1 kDa) in mammalian HEK293T cells, LY421490)
Lane 1: Marker [kDa] 250, 130, 95, 72, 55, 36, 28, 17, 10 Lane 2: Negative control (vector only transfected HEK293T lysate) Lane 3: Over-expression Lysate (Co-expressed with a C-terminal myc-DDK tag (~3.1 kDa) in mammalian HEK293T cells, LY421490)
Target mass (kDa)
22.3
22.3
Antibody dilution
1:250
1:125
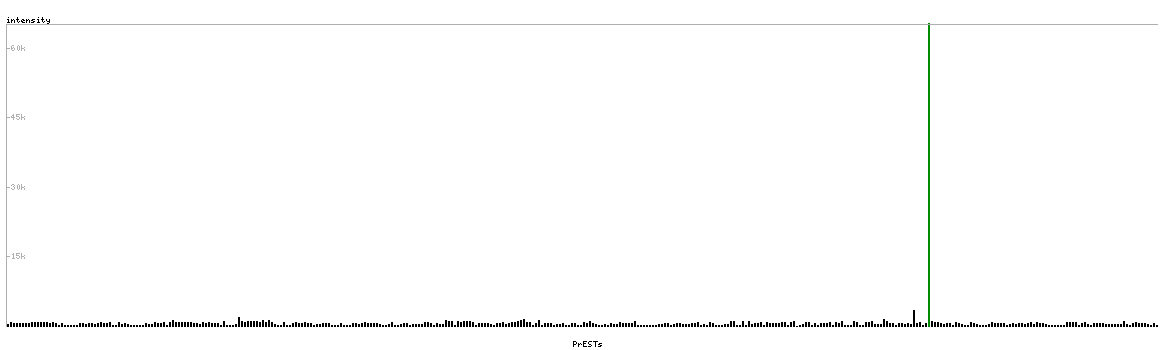
PROTEIN ARRAY
Antibody HPA021522
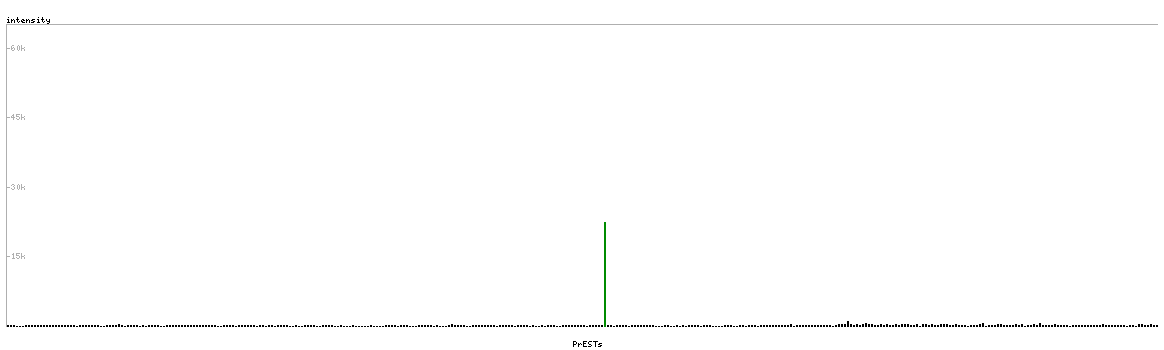
Antibody HPA048826
Standard validation
Supported
Pass with single peak corresponding to interaction only with its own antigen.
Supported
Pass with single peak corresponding to interaction only with its own antigen.
Figure description
Antibody specificity analysis with protein arrays. Predicted and matching interactions are shown in green.
Antibody specificity analysis with protein arrays. Predicted and matching interactions are shown in green.