We use cookies to enhance the usability of our website. If you continue, we'll assume that you are happy to receive all cookies. More information. Don't show this again.
Pearson correlation >0.6 for protein expression in cell lines using independent antibodies.
Validated
Pearson correlation >0.6 for protein expression in cell lines using independent antibodies.
Figure description
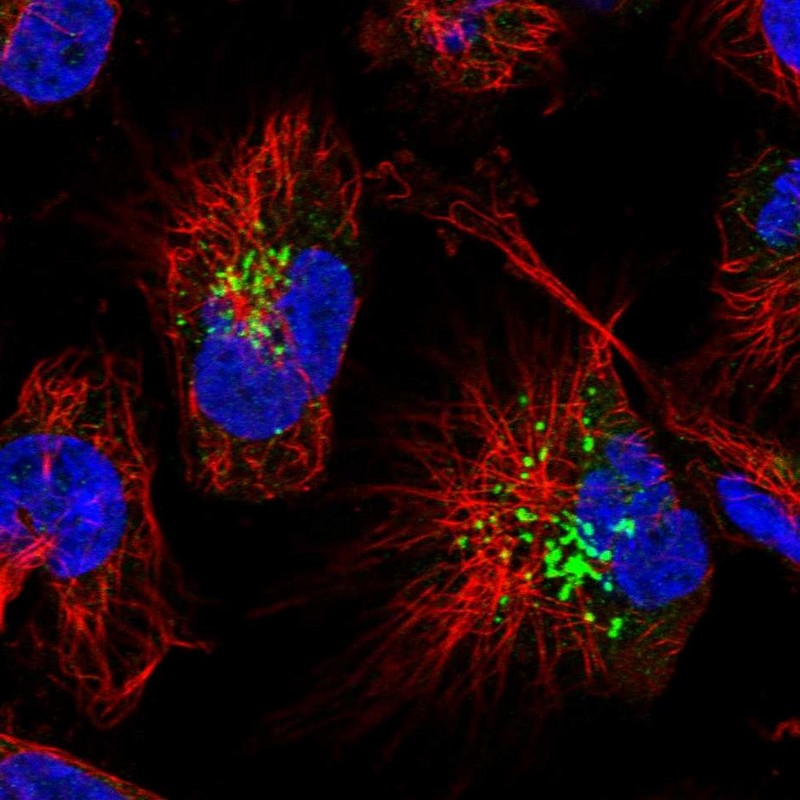
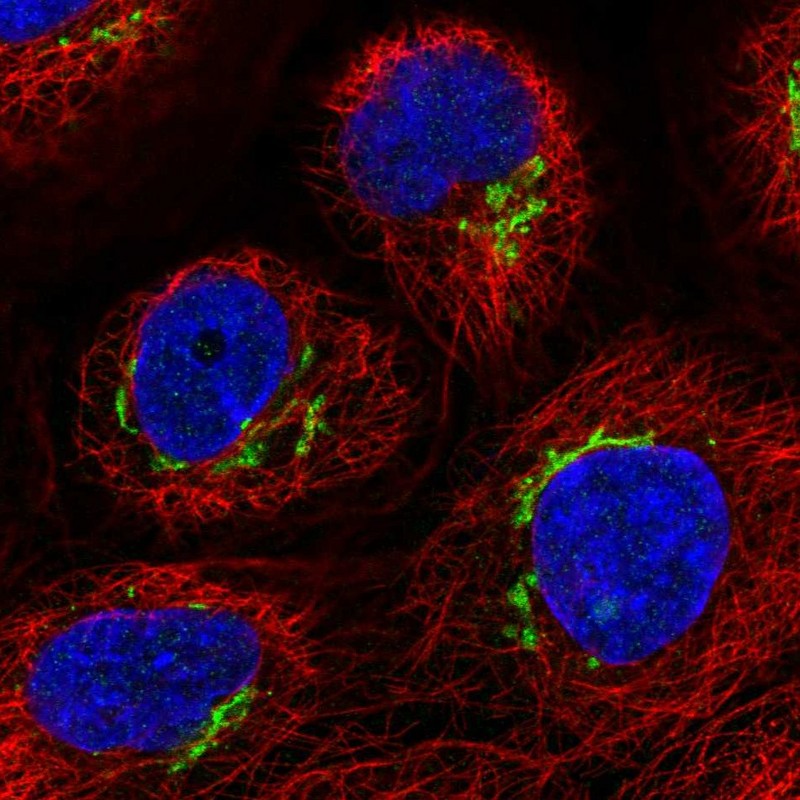
Distribution of protein expression (antibody staining). Pearson correlation with HPA050548 across 46 cell lines.
Distribution of protein expression (antibody staining). Pearson correlation with HPA043376 across 46 cell lines.
Formal validation: Independent
Validated
Spearman correlation >0.6 for protein expression in tissues using independent antibodies.
Validated
Spearman correlation >0.6 for protein expression in tissues using independent antibodies.
Figure description
Distribution of protein expression (antibody staining). Spearman correlation with HPA050548 across 73 cell types.
Distribution of protein expression (antibody staining). Spearman correlation with HPA043376 across 73 cell types.
Standard validation
Supported
Supported
Figure description
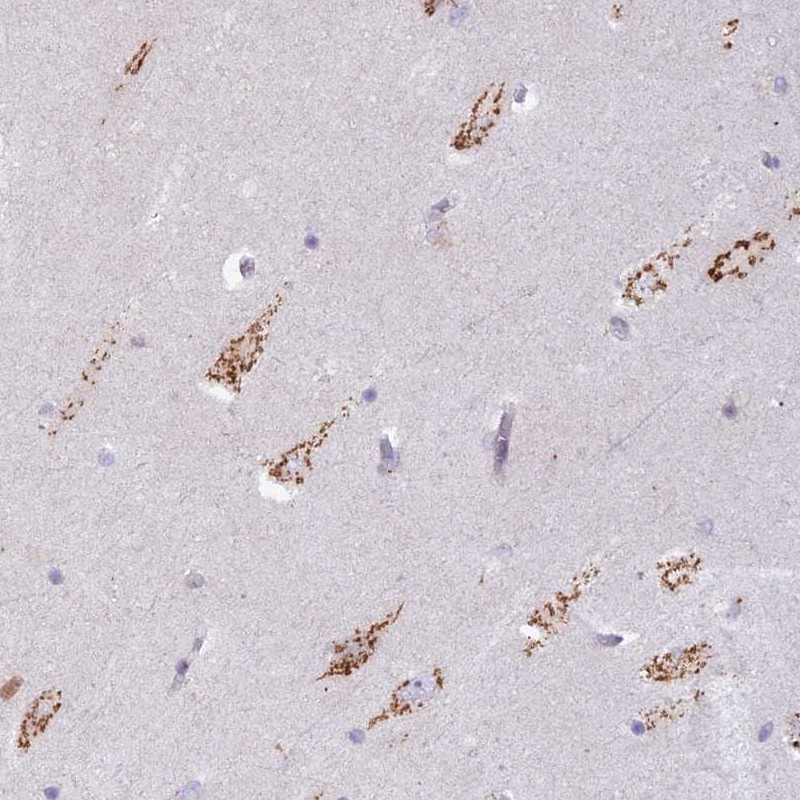
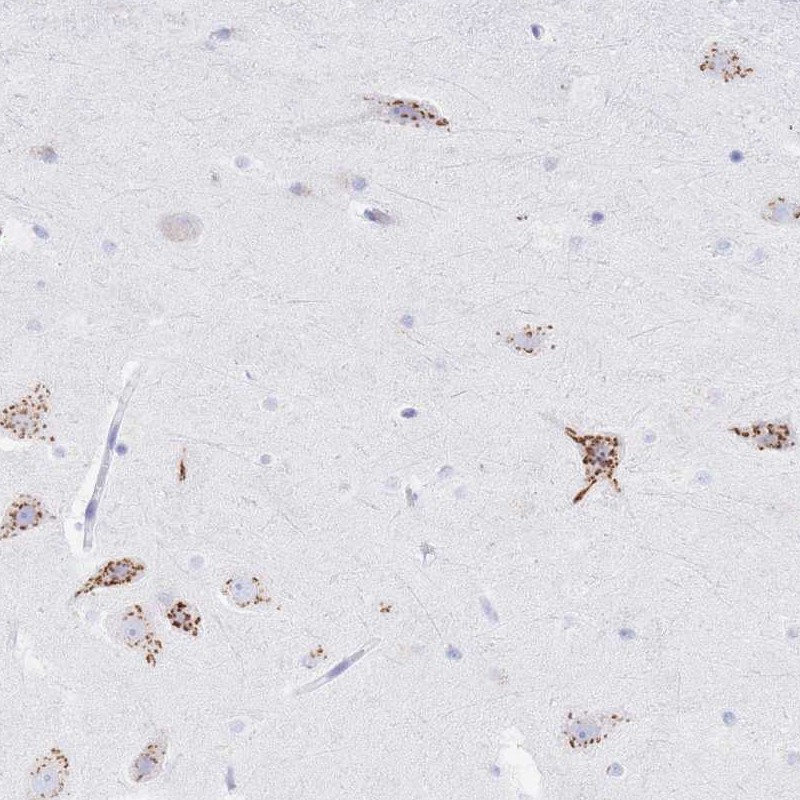
Immunohistochemical staining of human hippocampus shows strong granular cytoplasmic positivity in neurons.
Immunohistochemical staining of human hippocampus shows strong granular cytoplasmic positivity in neurons.
Expression
RNA: detected in 37 tissues Protein: detected in 64 cell types
RNA: detected in 37 tissues Protein: detected in 43 cell types
Retrieval
HIER pH6
HIER pH6
Antibody dilution
1:150
1:1500
Literature conformity
Consistent with gene/protein characterization data.
Consistent with gene/protein characterization data.
RNA consistency
Mainly consistent with RNA expression data.
Mainly consistent with RNA expression data.
WESTERN BLOT
Antibody HPA043376
Antibody HPA050548
Standard validation
Uncertain
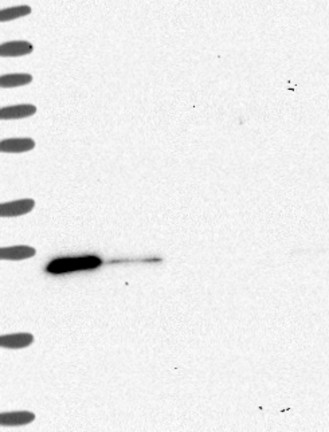
Analysis performed using a standard panel of samples. Single band differing more than +/-20% from predicted size in kDa and not supported by experimental and/or bioinformatic data.
Supported
Analysis performed using a standard panel of samples. Single band corresponding to the predicted size in kDa (+/-20%).
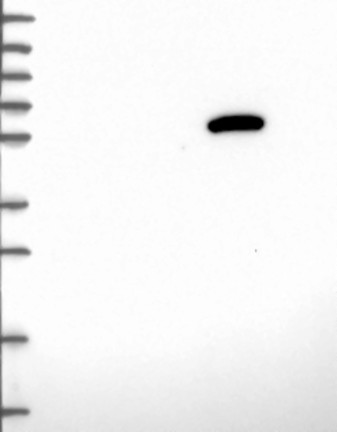
Figure description
Lane 1: Marker [kDa] 250, 130, 95, 72, 55, 36, 28, 17, 10 Lane 2: RT4 Lane 3: U-251 MG Lane 4: Human Plasma Lane 5: Liver Lane 6: Tonsil
Lane 1: Marker [kDa] 250, 130, 95, 72, 55, 36, 28, 17, 10 Lane 2: RT4 Lane 3: U-251 MG Lane 4: Human Plasma Lane 5: Liver Lane 6: Tonsil
Target mass (kDa)
24.7, 16.2, 11.6
24.7
Antibody dilution
1:250
1:250
PROTEIN ARRAY
Antibody HPA043376
Antibody HPA050548
Standard validation
Supported
Pass with single peak corresponding to interaction only with its own antigen.
Supported
Pass with single peak corresponding to interaction only with its own antigen.
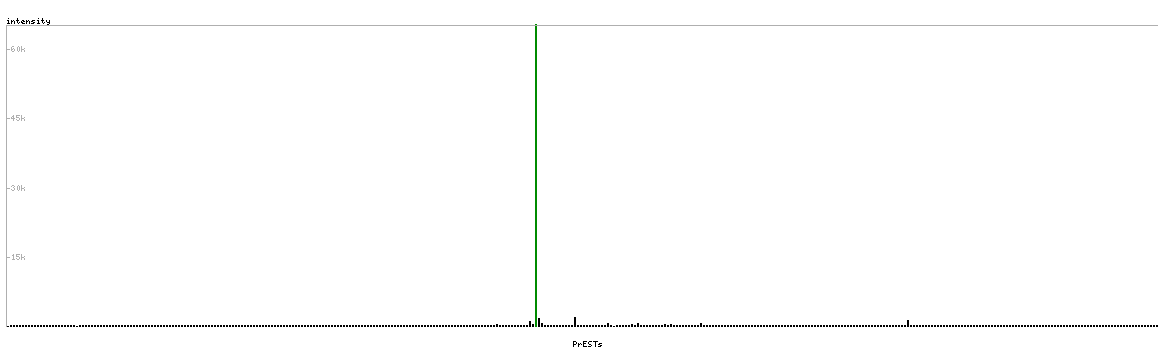
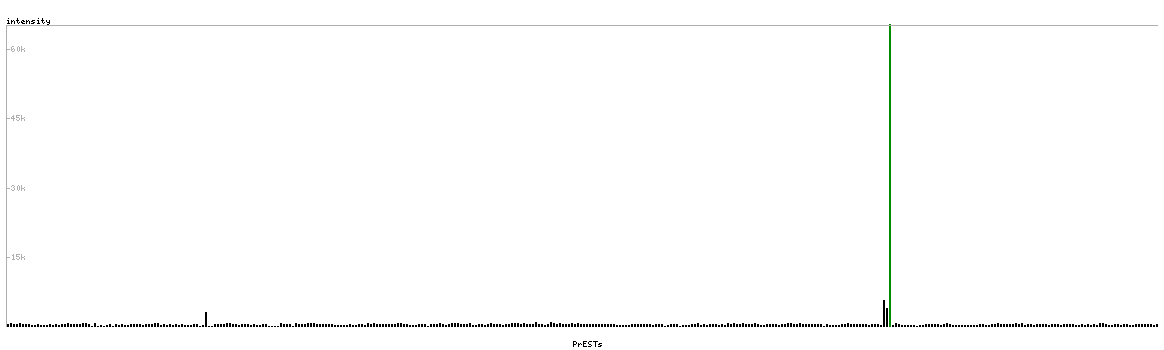
Figure description
Antibody specificity analysis with protein arrays. Predicted and matching interactions are shown in green.
Antibody specificity analysis with protein arrays. Predicted and matching interactions are shown in green.
Antibody dilution
1:3000
1:2000
ANTIGEN INFORMATION
Antibody HPA043376
Antibody HPA050548
Antigen
Recombinant protein fragment
Recombinant protein fragment
Length (aa)
51
75
Antigen sequence
MDASLGNLFARSALDTAARSTKPPRYKCGISKACPEKHFAFKMASGAANV
V